

A graphical abstract works when a reader who is not in your lab can get the take-home message in a few seconds, even when the image is only a couple of hundred pixels high. That is how the image is actually shown: Elsevier's ScienceDirect window, which we opened on 20 November 2026, scales the file into a 500 × 200 pixel rectangle, and other publishers use similarly small table-of-contents slots. The layouts that survive that reduction have a few things in common: one message, a clear left-to-right or top-to-bottom path, short labels, and a canvas that matches the journal's shape.
The 12 examples below all come from FigPad's scientific visualization gallery. Every image was generated in FigPad; none is a figure from a published paper. We opened the individual template pages on 20 November 2026. Use them as layout references, then replace the content with your own study. Two submission issues show up in more than one example and are flagged where they appear: a title inside the frame, which Elsevier's graphical abstract page tells you not to include (it asks you not to use a heading such as "graphical abstract"), and data plots, which some publishers do not want in a graphical abstract. For the size and file-type rules, see our size and format guide. For the step-by-step build, see How to Make a Graphical Abstract in 2026.
1. A numbered clinical workflow (CAR-T cell therapy)

This CAR-T cell therapy template is a square, six-step procedure: patient leukapheresis and T-cell isolation, CAR construct design, ex vivo expansion, lymphodepletion, infusion, and a closing panel of target-cell killing with a before/after tumour sketch. Numbered steps with short verb phrases are a reliable pattern for a methods-heavy story. The canvas is square, which matches the Cell Press shape discussed in the size guide. The last panel already tries to show an outcome as well as a method; if your journal's thumbnail is very short, that last panel is the first thing to simplify.
2. The same story as a timeline plus one outcome (CAR-T treatment lifecycle)
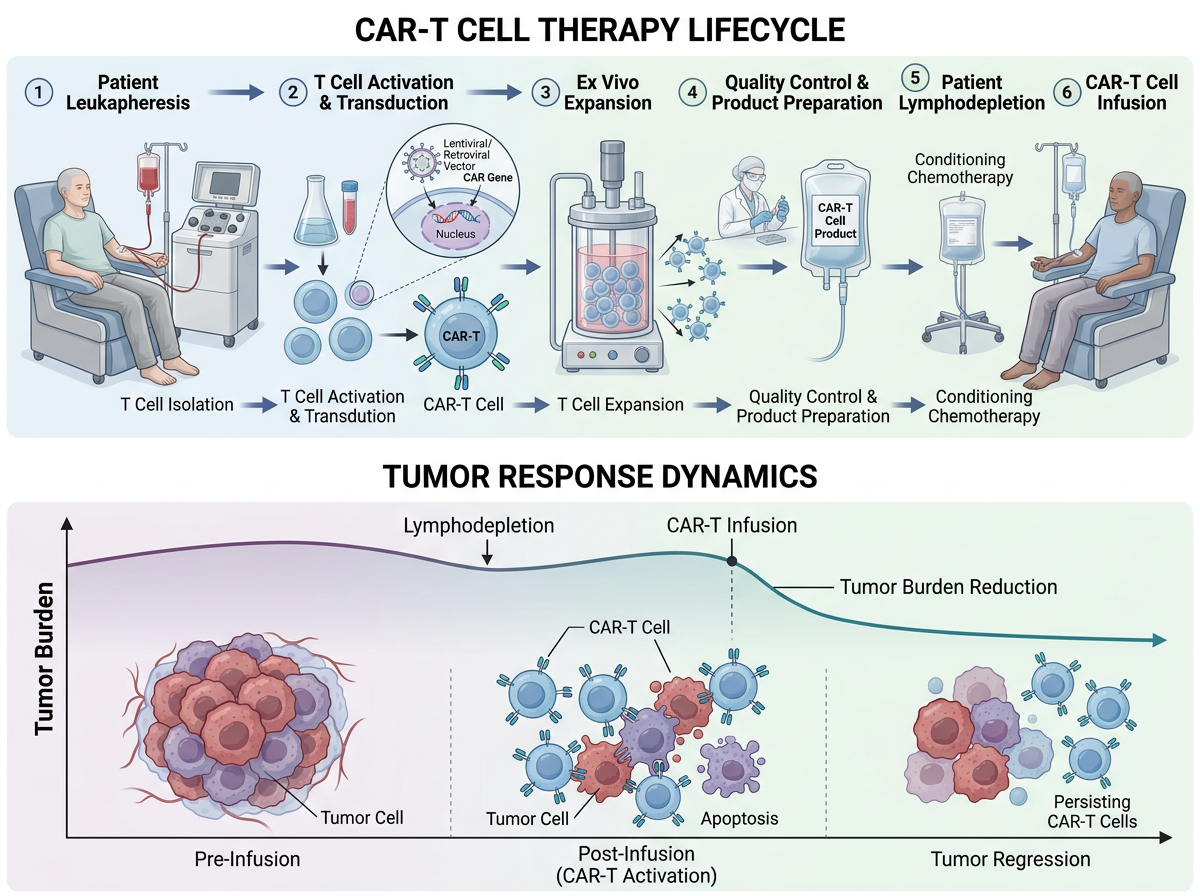
The CAR-T treatment lifecycle template tells a closely related story in a wide format. The top row is a left-to-right lifecycle, from leukapheresis to infusion; the bottom row is one outcome, a tumour-burden curve annotated at lymphodepletion and infusion. That pairing — process above, result below — is often clearer in a table of contents than a second method panel. The title at the top is useful in a gallery; remove an in-image heading before submitting to a journal that forbids one, including Elsevier as of the page we opened today.
3. A cycle, drawn as a cycle (lipid nanoparticle mRNA delivery)

The lipid nanoparticle mRNA delivery template puts a cycle on a circular, square canvas: self-assembly, characterization, administration and uptake, endosomal escape and mRNA release, antigen translation, and immune activation. A ring is the right shape when the science is a cycle rather than a one-way protocol. The risk is typography: labels around the rim have to stay large enough to read at thumbnail size, and anything sitting in the small centre will disappear first.
4. The same family, in a softer left-to-right style
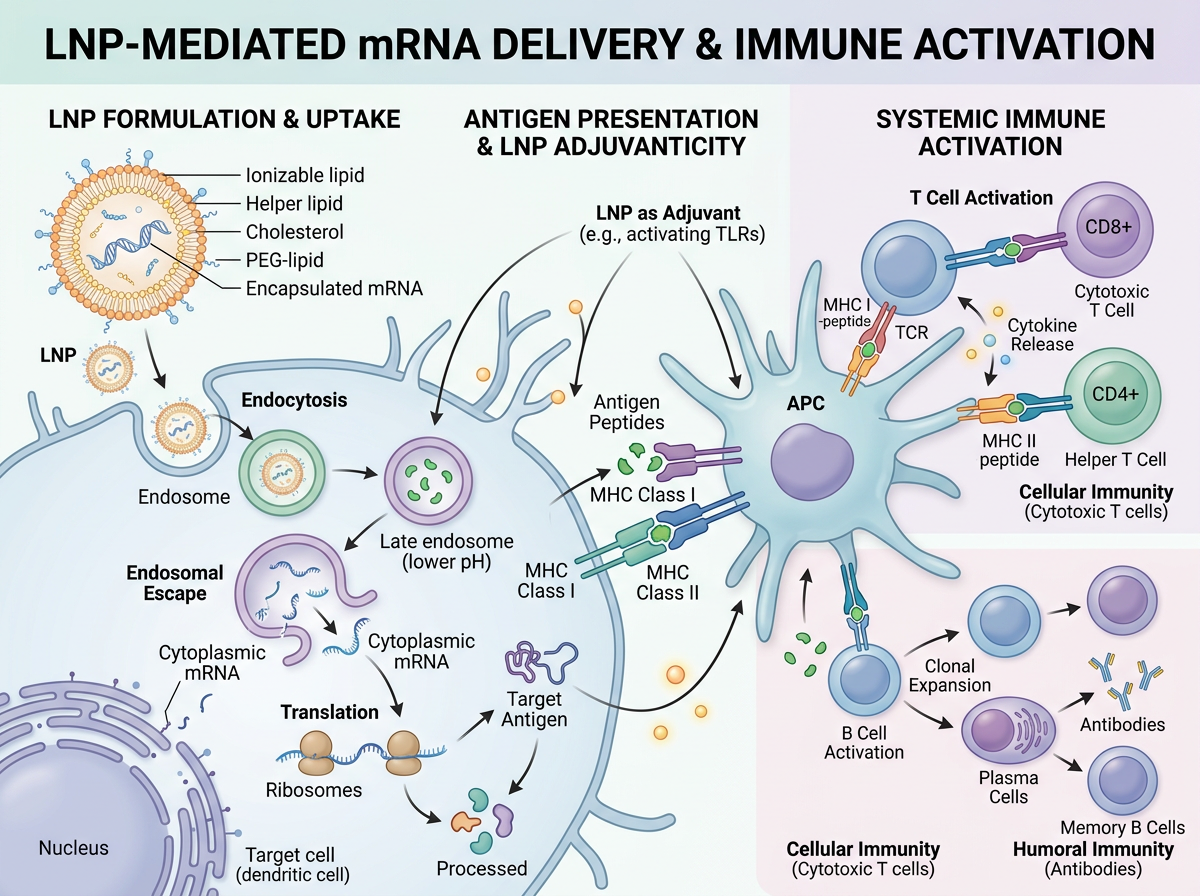
This soft-biomedical variant covers the same LNP-to-immune-activation family as a wide, left-to-right scene: formulation and uptake on the left, antigen presentation on an antigen-presenting cell in the centre, and systemic T-cell and B-cell activation on the right. It is a reminder that style is a layout choice, not just decoration. A wide strip (closer to Elsevier's 500 : 200 window) and a square cycle can tell the same story; you pick the one that matches the journal, then edit. The in-image title should come off before an Elsevier submission.
5. A screening workflow that also includes plots (organoid drug screening)
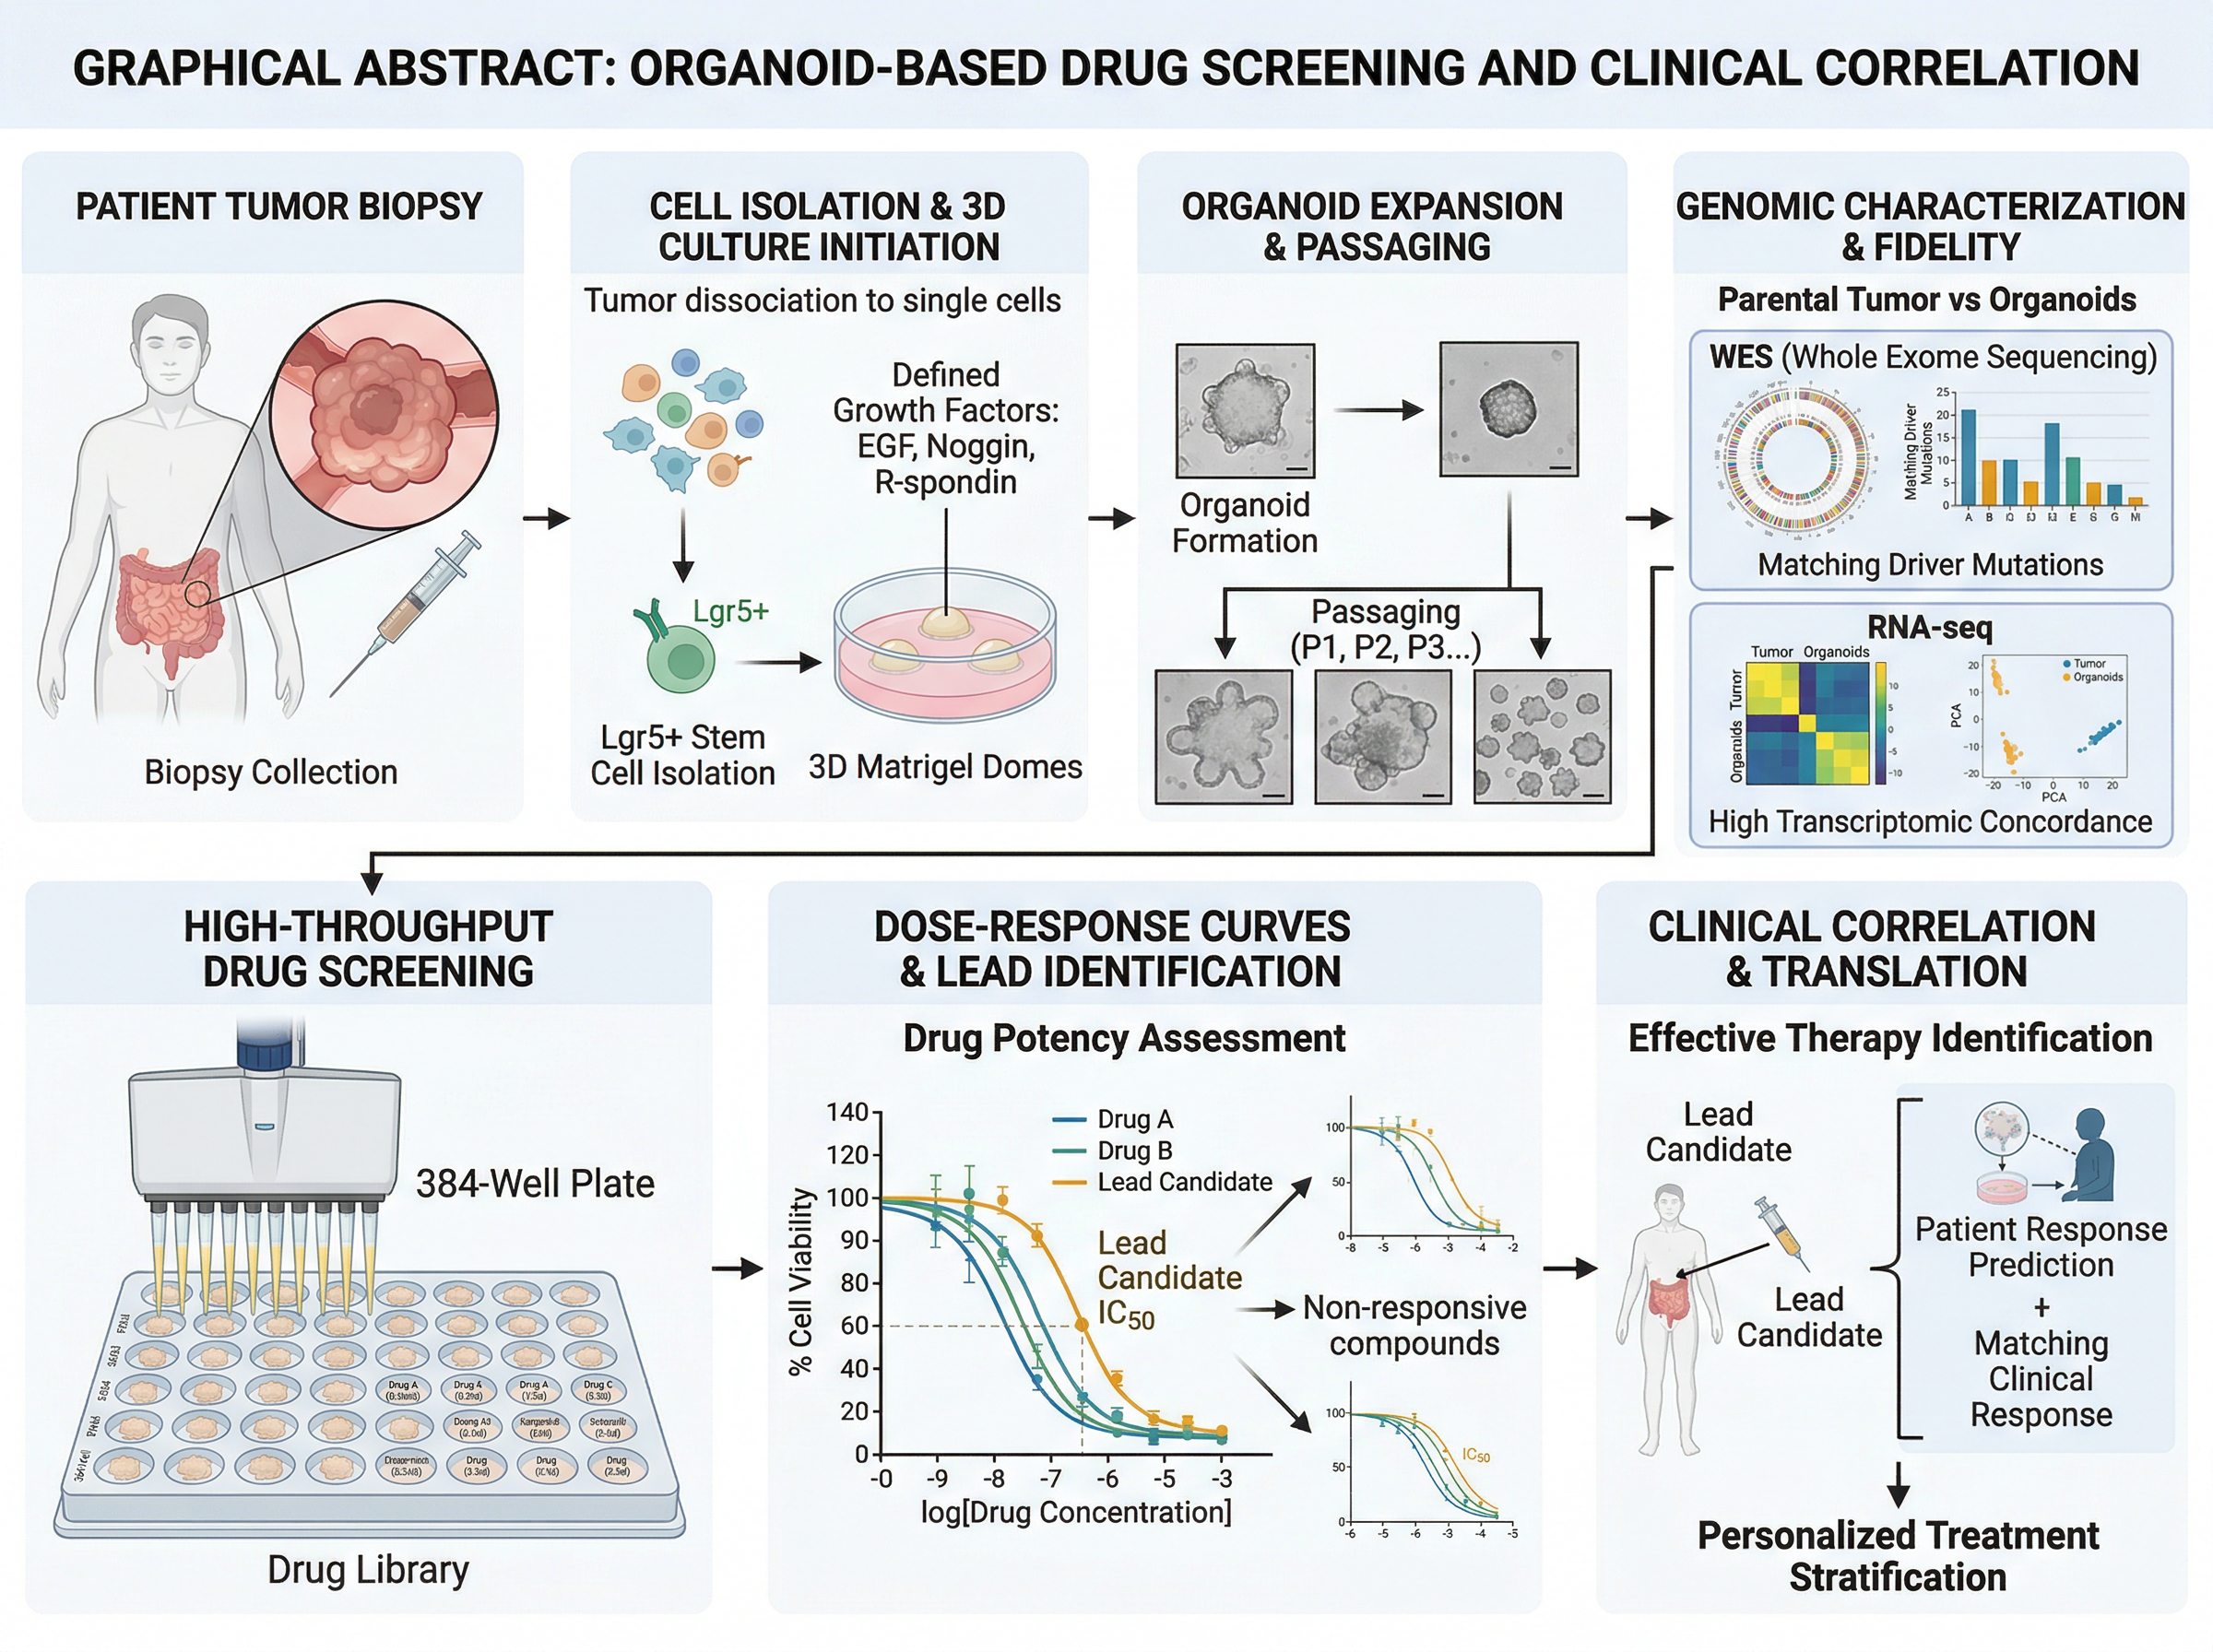
The organoid-based drug screening template is a left-to-right pipeline: biopsy, cell isolation and 3D culture, expansion, genomic characterization, a 384-well screen, dose-response curves, and clinical correlation. As a map of a study it is easy to follow. Two caveats if you adapt it for a journal. First, the heading starts with "GRAPHICAL ABSTRACT:", which Elsevier's page tells you not to put in the image. Second, several panels are plots (sequencing summaries, dose-response curves). Some publishers, including the Cell Press guide we flagged in the size article because we could not open the PDF directly, are reported to ask that graphical abstracts contain no data items. If that is your target, keep the workflow and drop the charts.
6. The same idea as a closed loop (organoid precision medicine)
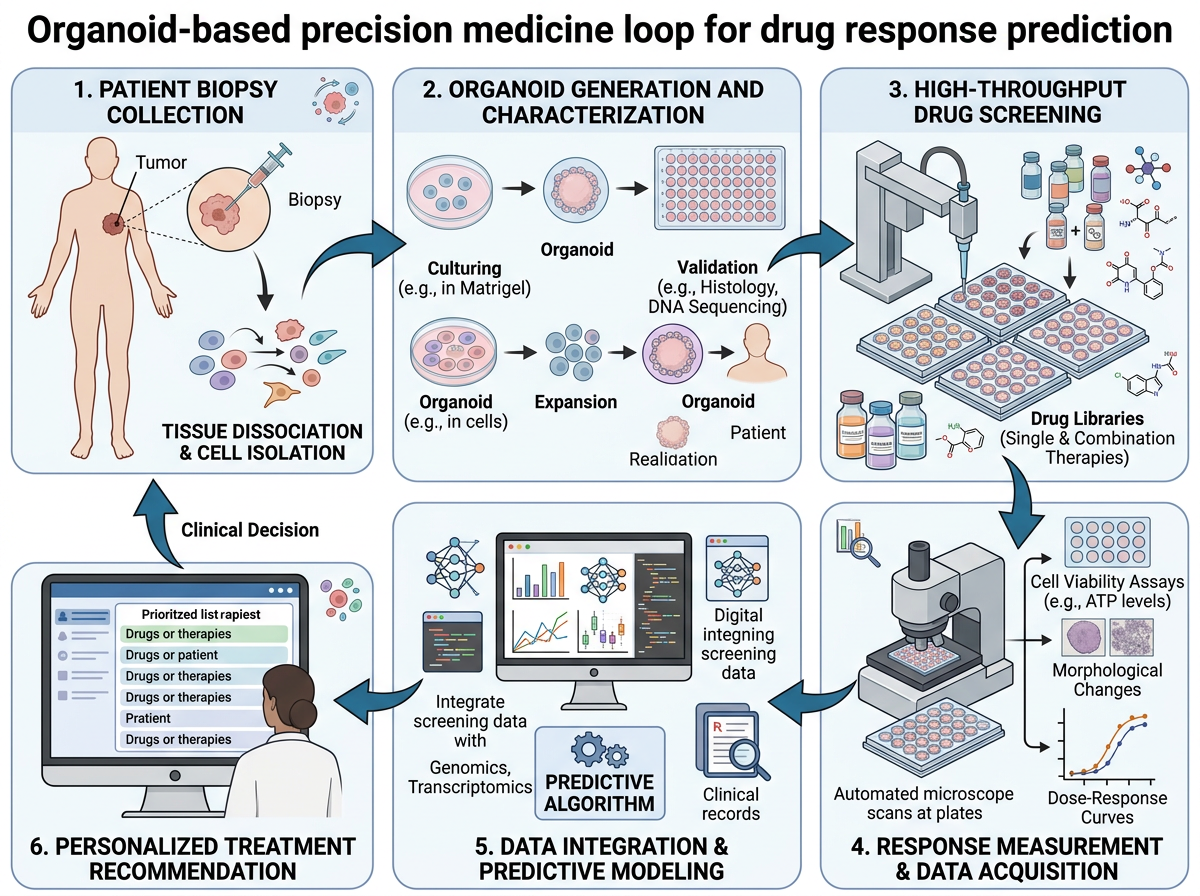
The clean-vector precision-medicine loop rearranges a similar organoid-screening story into six numbered panels that return to the start: biopsy, organoid generation, screening, response measurement, data integration, and a treatment recommendation. A loop is the right shape when the point is a cycle that feeds a clinical decision, not a one-off experiment. This version is simpler than example 5, which helps at thumbnail size. Check labels before you export: gallery drafts can still carry placeholder or messy text on screens and in legends, and those will be unreadable (or worse, misleading) once the image is shrunk.
7. A side-by-side comparison (PROTAC versus occupancy inhibition)
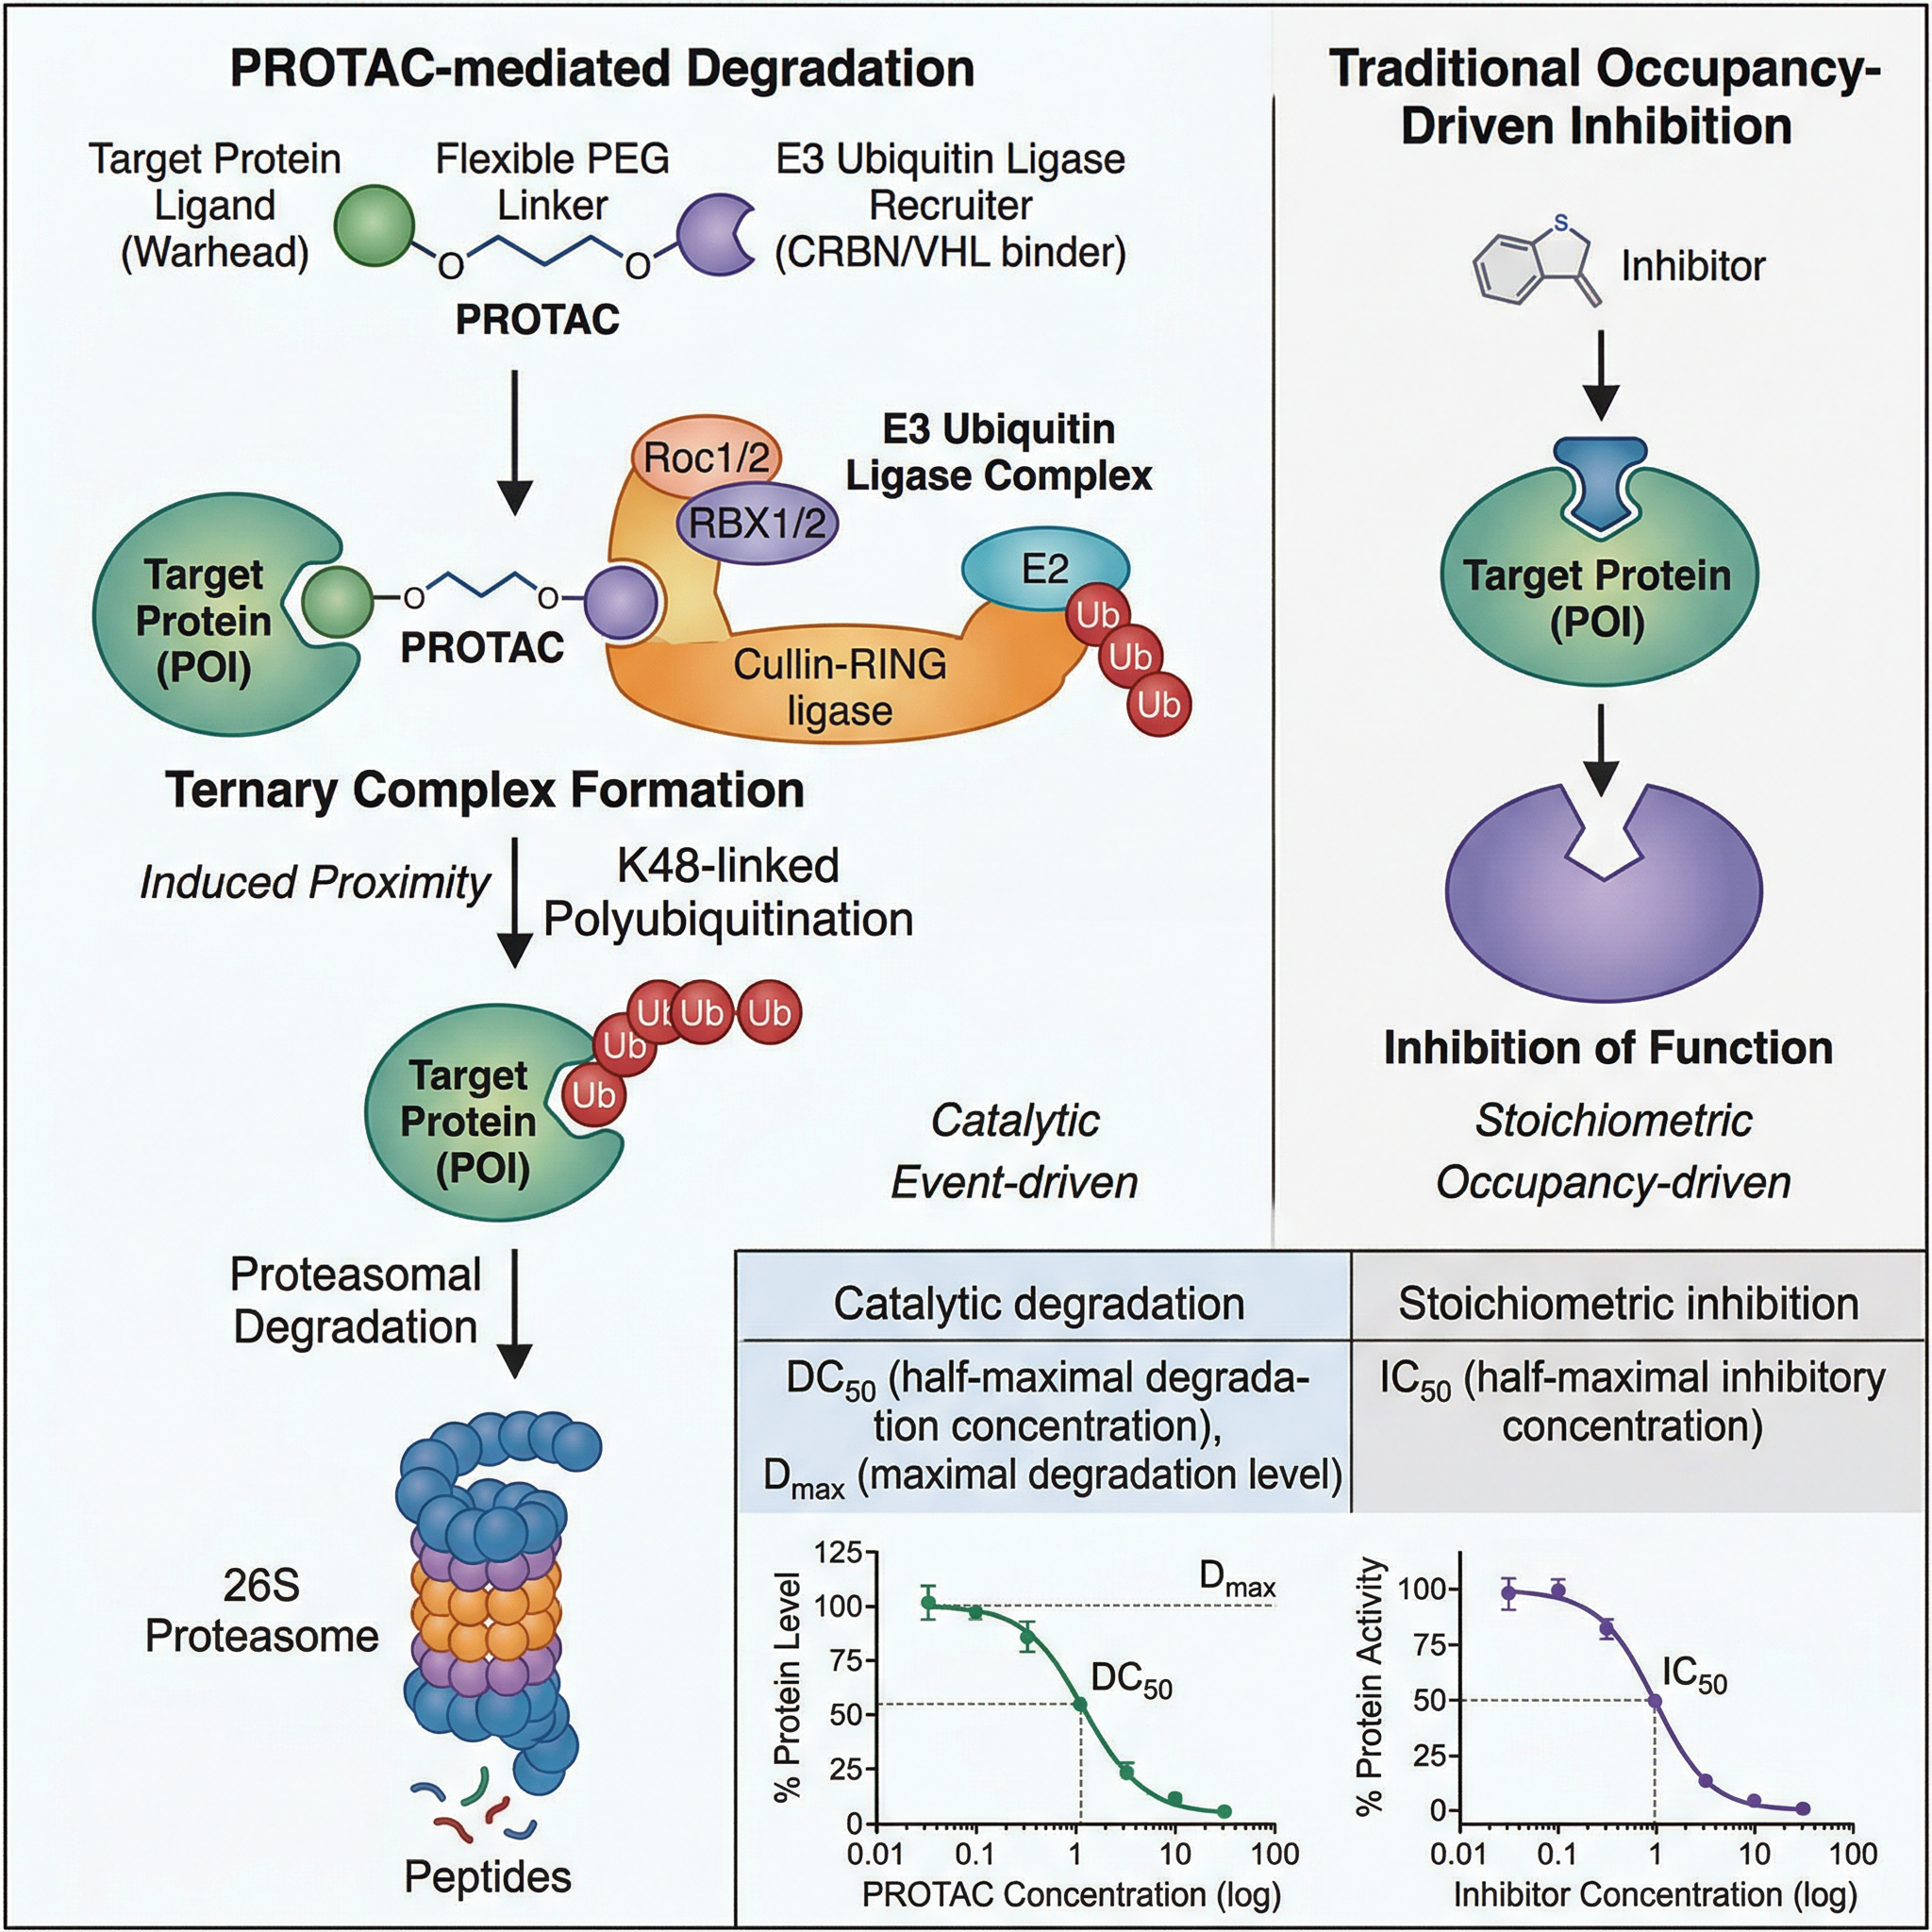
The PROTAC targeted protein degradation template is a comparison: PROTAC-mediated degradation down the left, traditional occupancy-driven inhibition on the right, with two small illustrative curves at the bottom. If your paper's message is "this works differently from the usual drug", a split layout makes that difference visible without a paragraph of labels. The curves help in a review figure; as with example 5, confirm whether your journal allows data items in the graphical abstract before you keep them.
8. The mechanism alone, in four steps (PROTAC, clean vector)
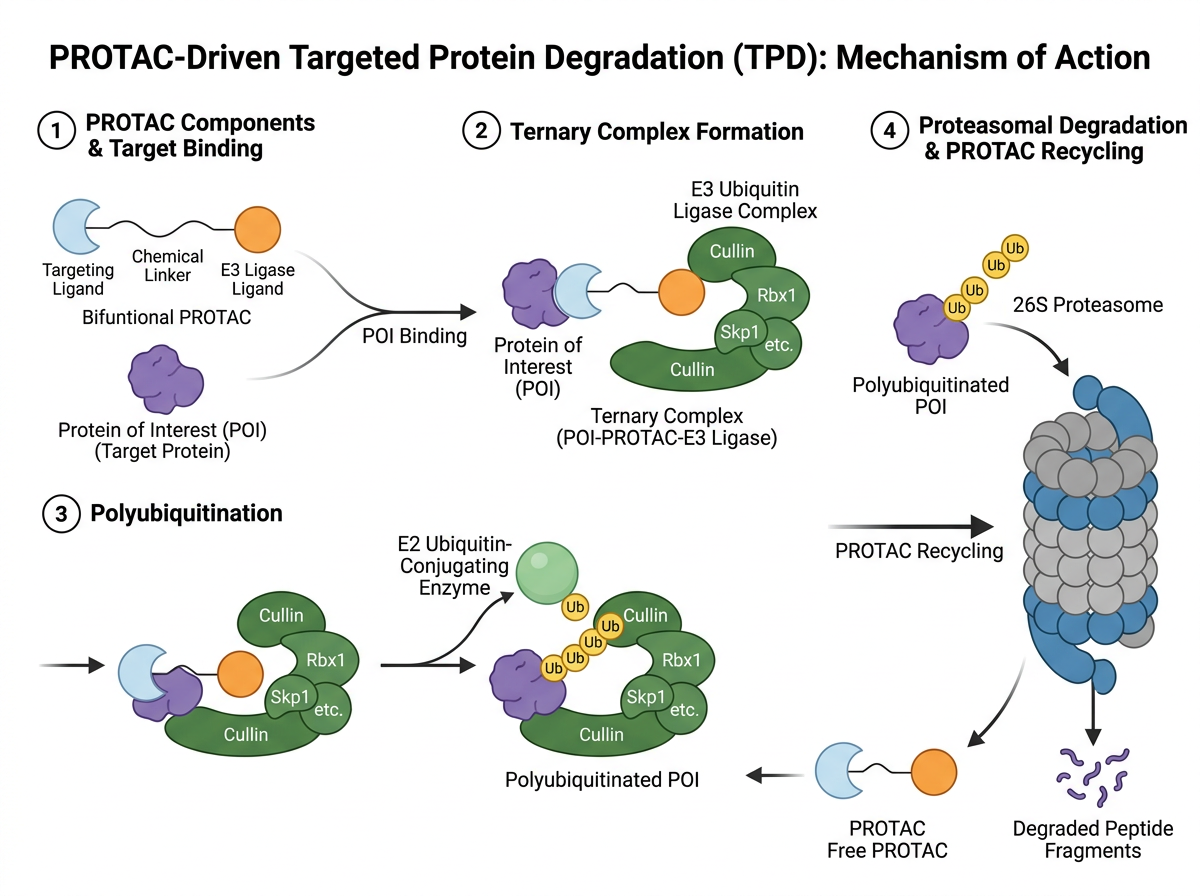
The clean-vector PROTAC mechanism drops the comparison and the curves and keeps four numbered steps: components and target binding, ternary complex formation, polyubiquitination, and proteasomal degradation with recycling of the PROTAC. When the paper's claim is the mechanism, this is usually the stronger graphical abstract: fewer objects, larger steps, one reading path. Examples 7 and 8 together are a useful test — start with the fuller figure, then delete until the thumbnail still makes the point.
9. Architecture, mechanism and a comparison (base editing)
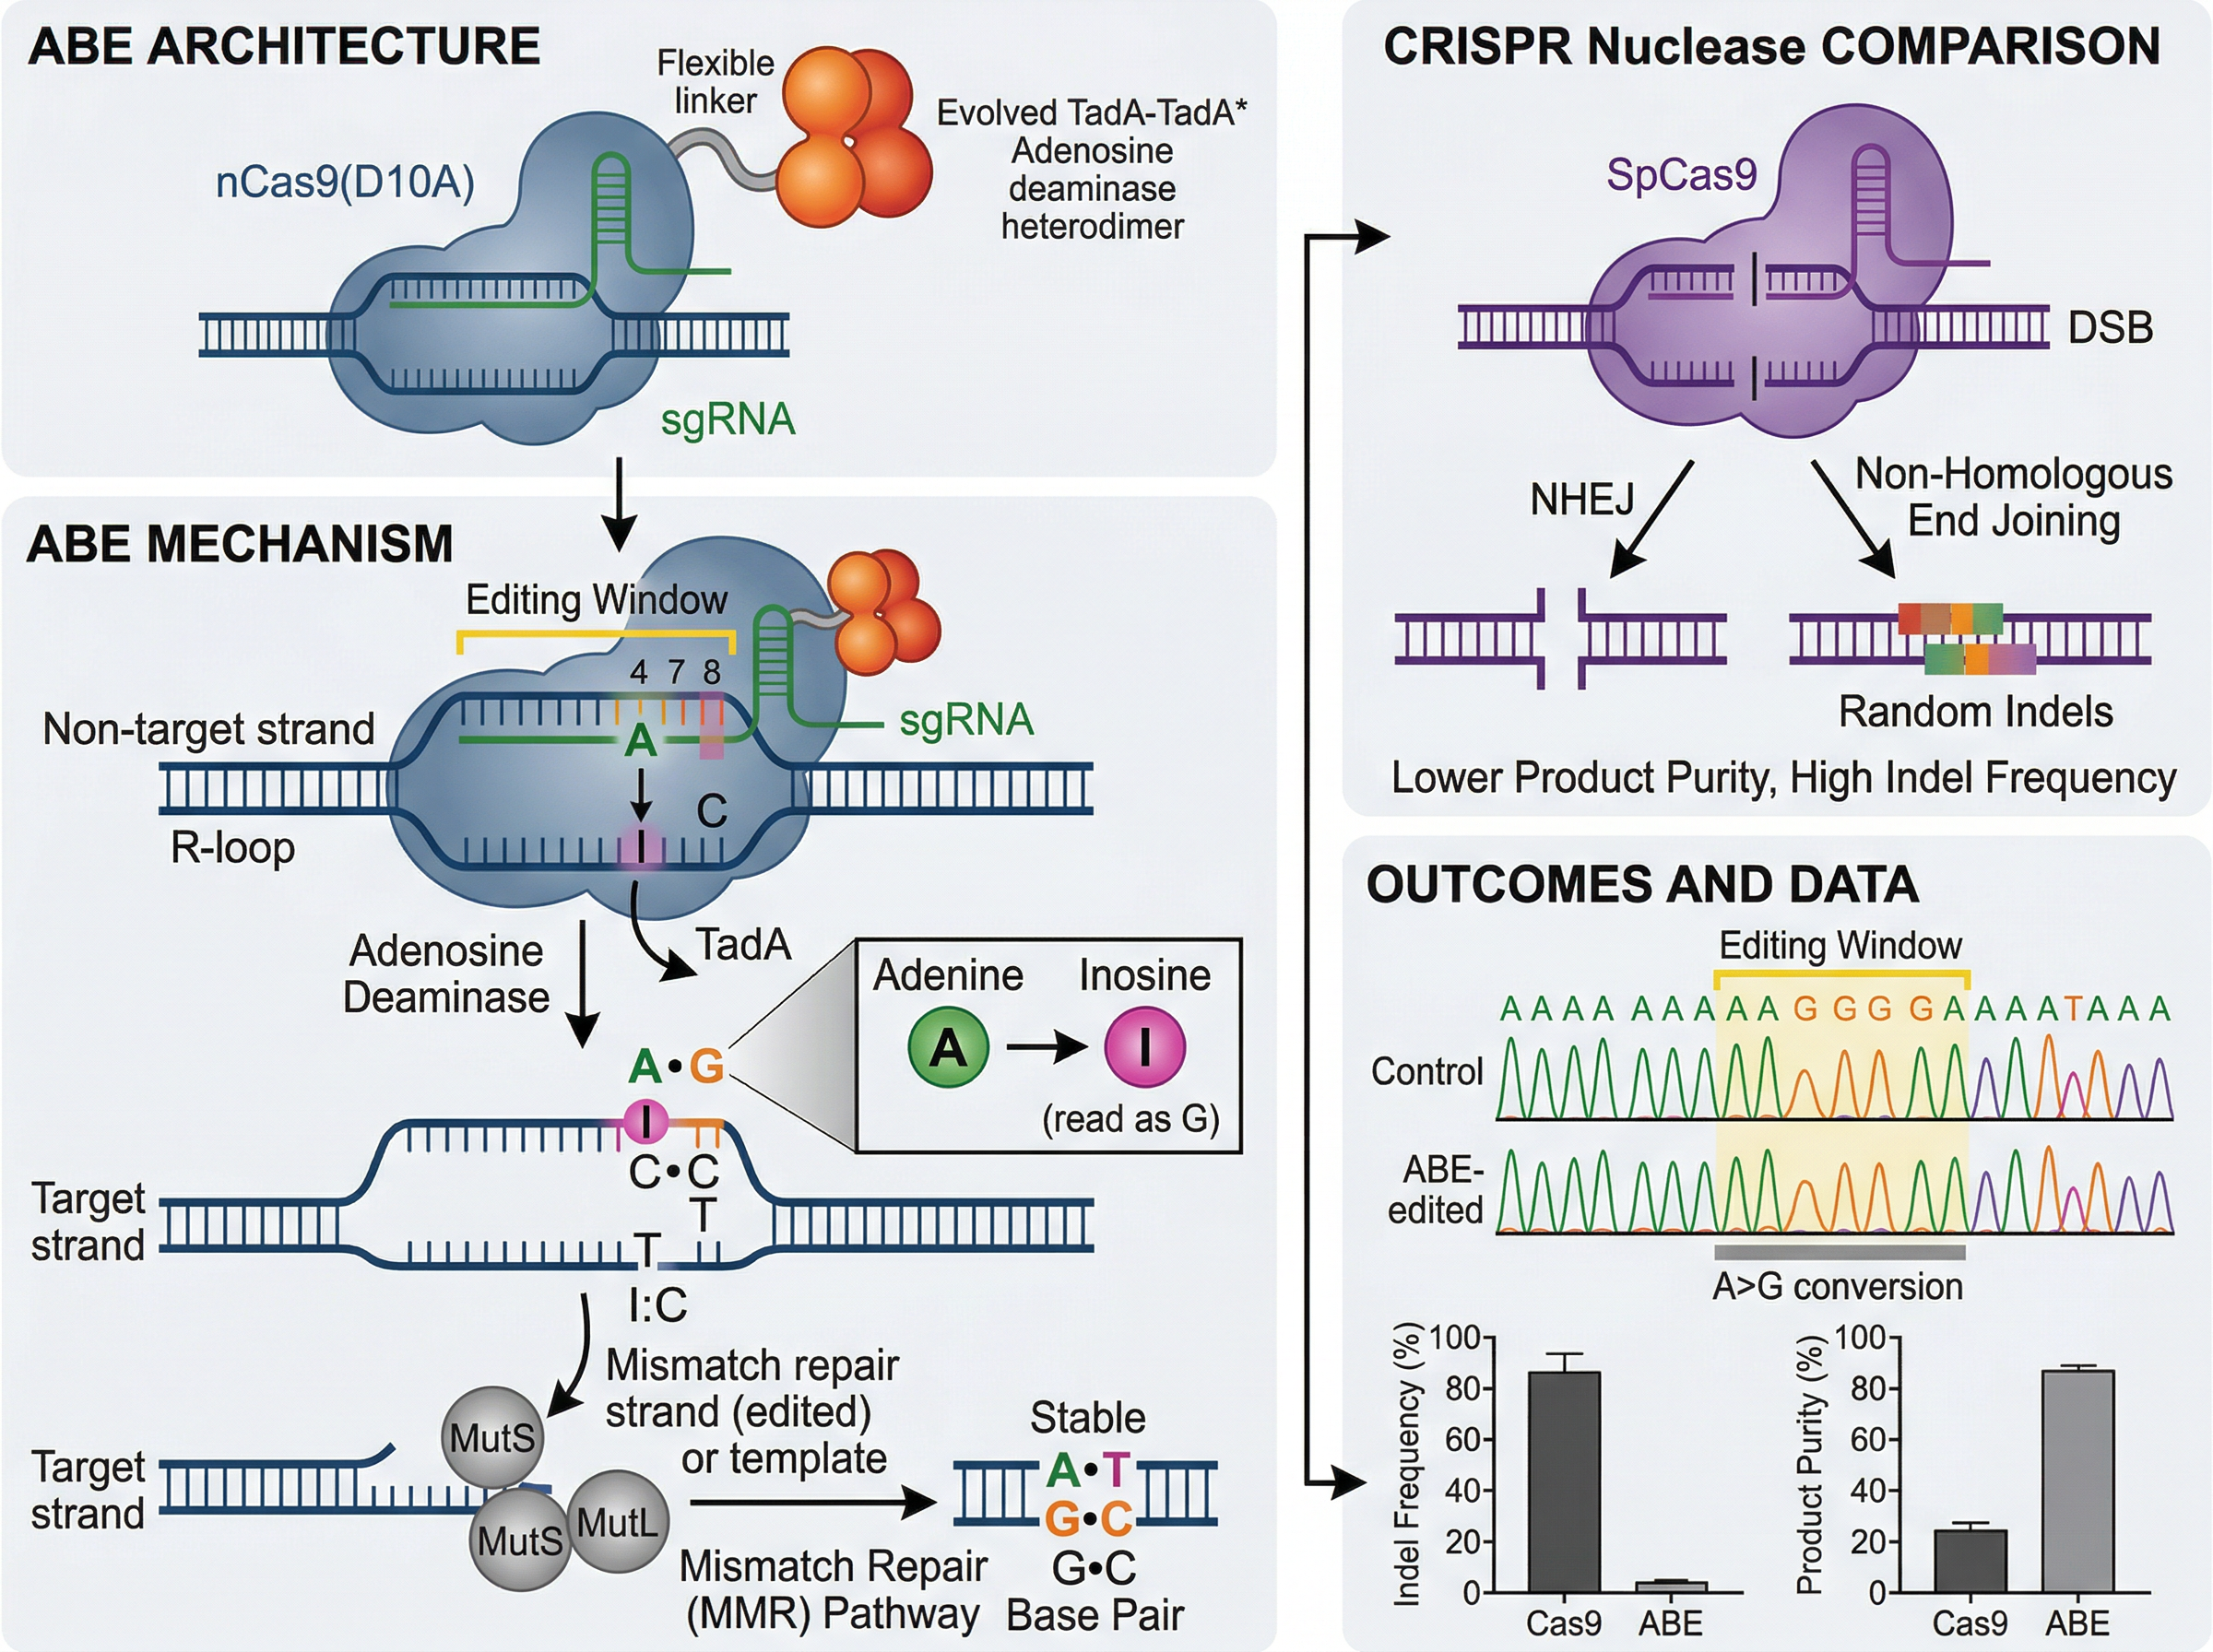
The base editing template is denser: editor architecture and the editing mechanism on the left, a CRISPR nuclease comparison on the right, and an outcomes panel with traces and bar charts. As a teaching figure it is clear. As a table-of-contents graphic it is asking the reader to take in three messages at once. If you start from a layout like this, pick one: how the editor is built, how the chemistry works, or how the outcome differs from a nuclease — not all three. The data panel is the first thing to cut for journals that do not want plots in a graphical abstract.
10. A computational pipeline plus applications (AlphaFold)
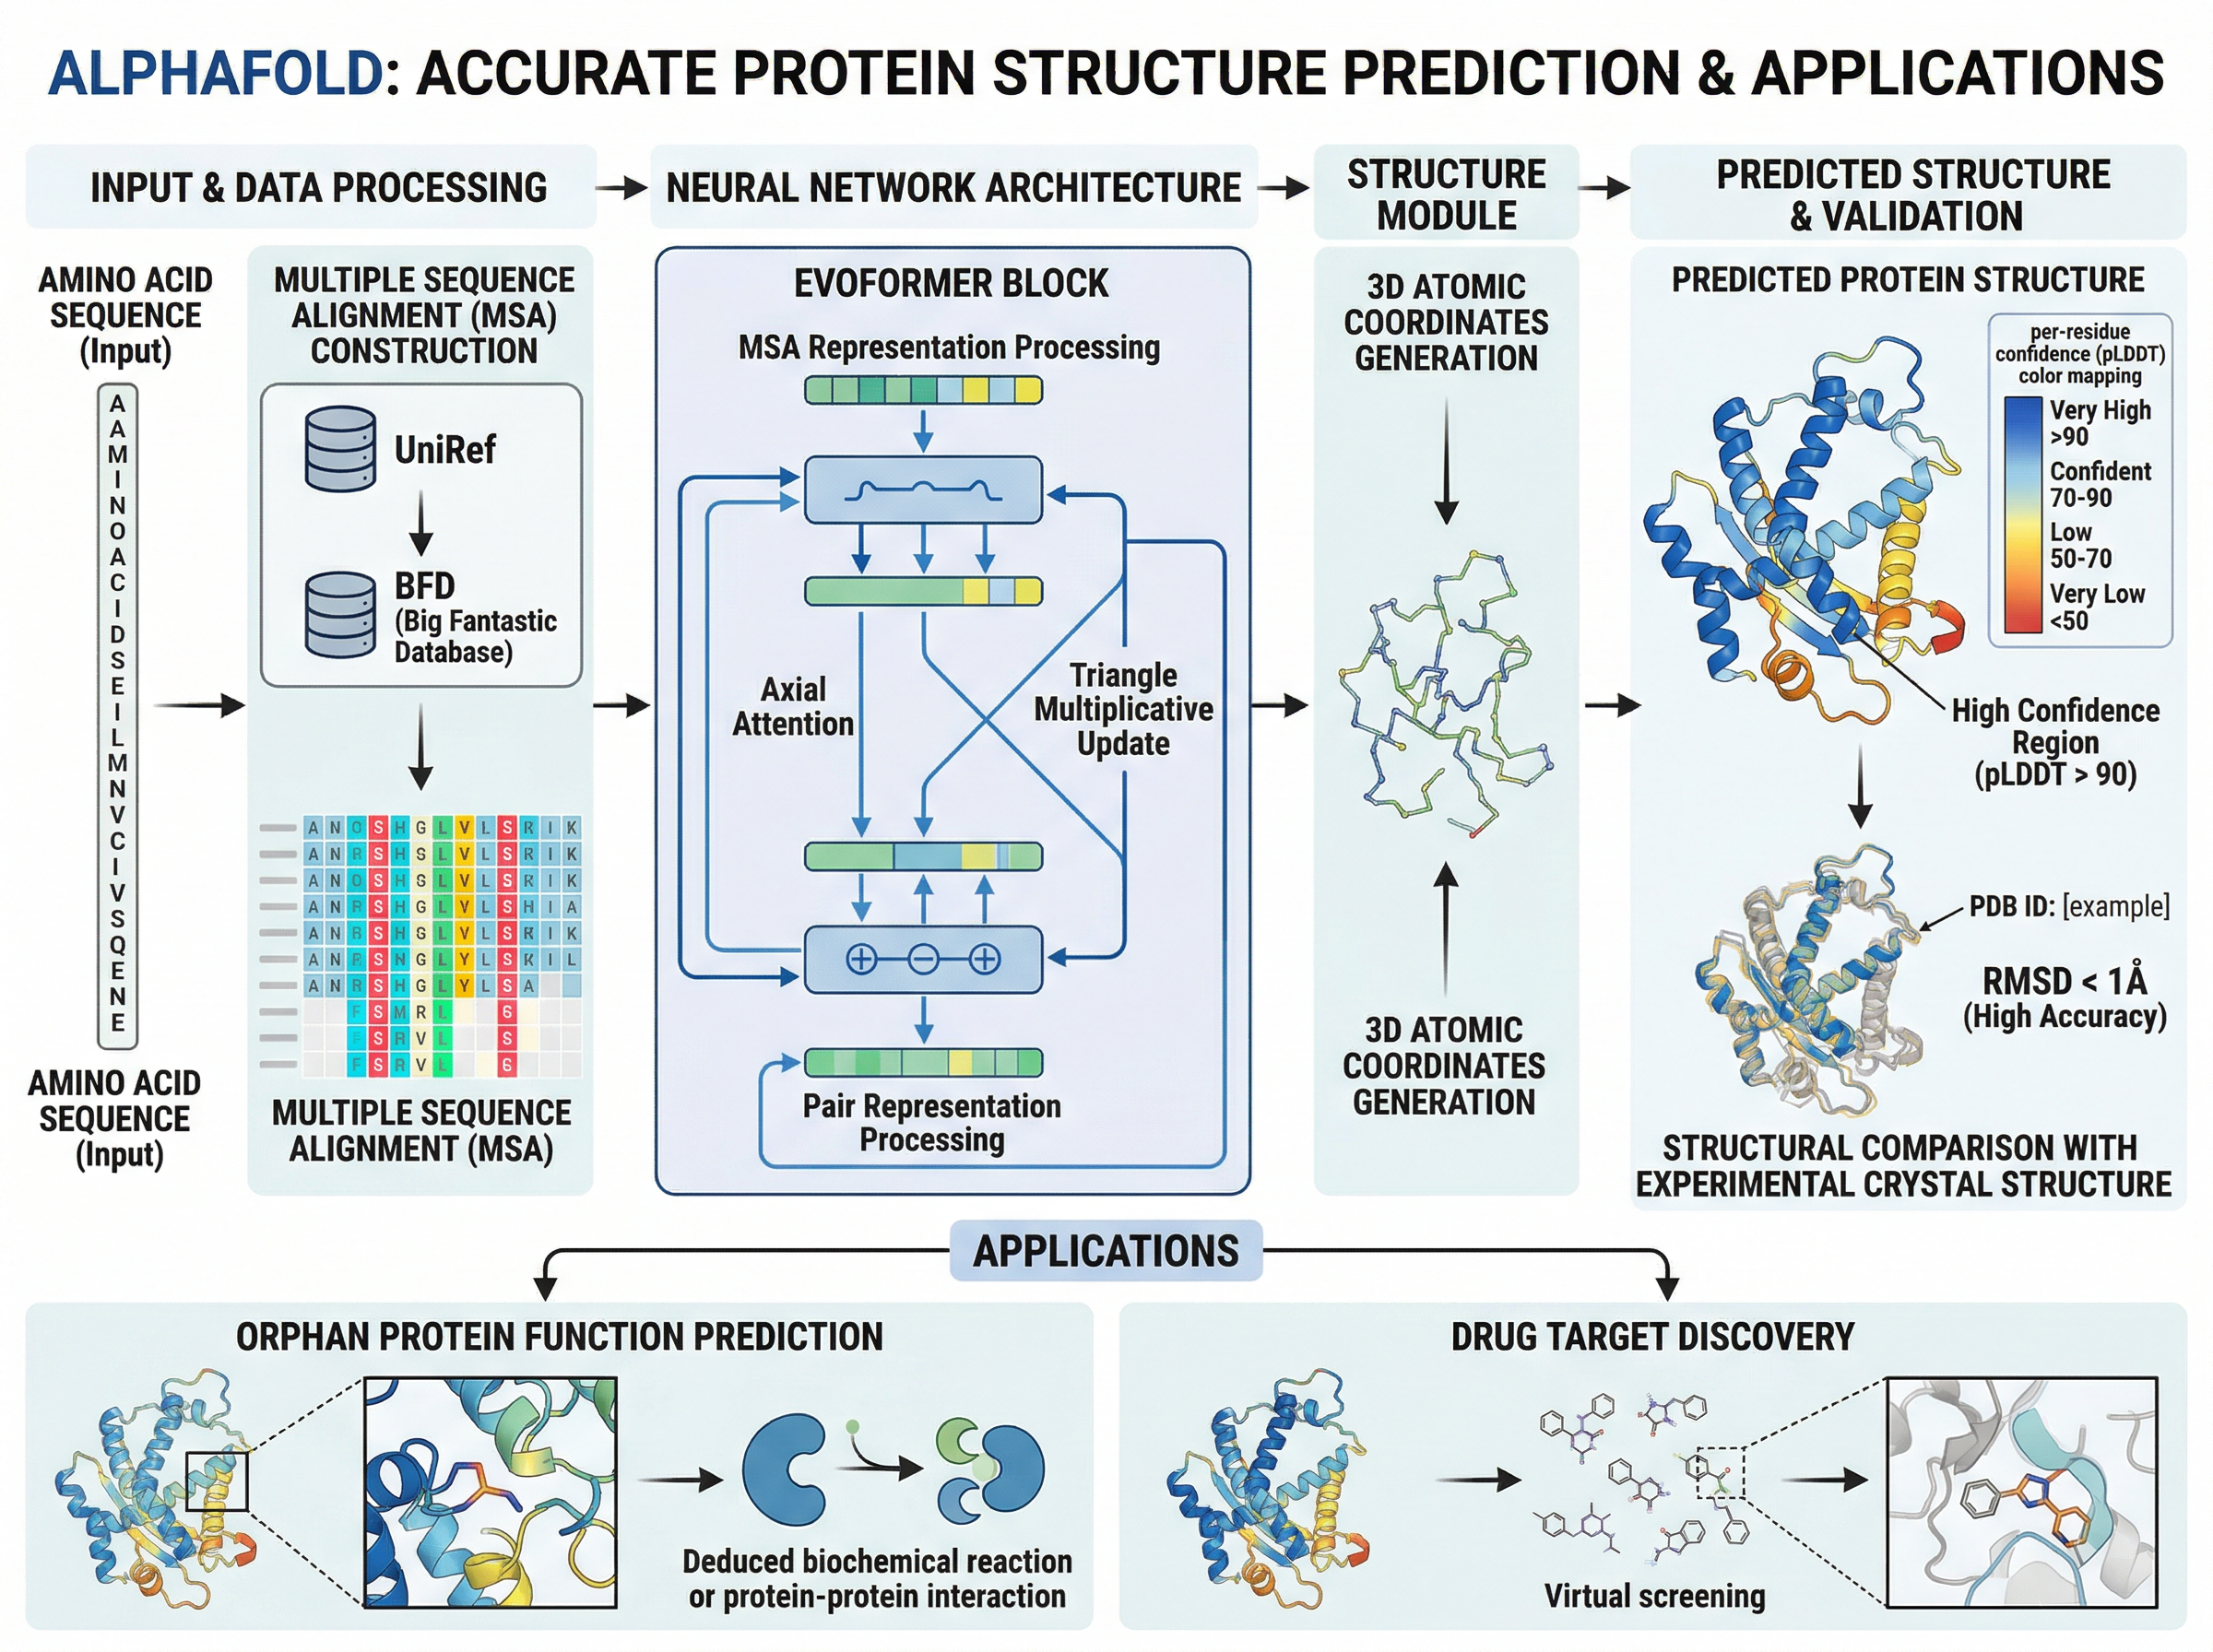
The AlphaFold protein structure prediction template is a left-to-right computational pipeline — sequence and alignment, network architecture, structure module, predicted structure — with a second row of applications (function prediction and drug-target discovery). That two-row plan is a good default for a methods-plus-use paper, and the wide canvas suits an Elsevier-like window. It is also busy: the in-image title should come off for Elsevier, and several labels will not survive a reduction to 200 pixels high. Export a 200-pixel-high preview, as Elsevier's page implies you should, and delete anything you can no longer read.
11. An anatomical path, top to bottom (microbiome–gut–brain axis)
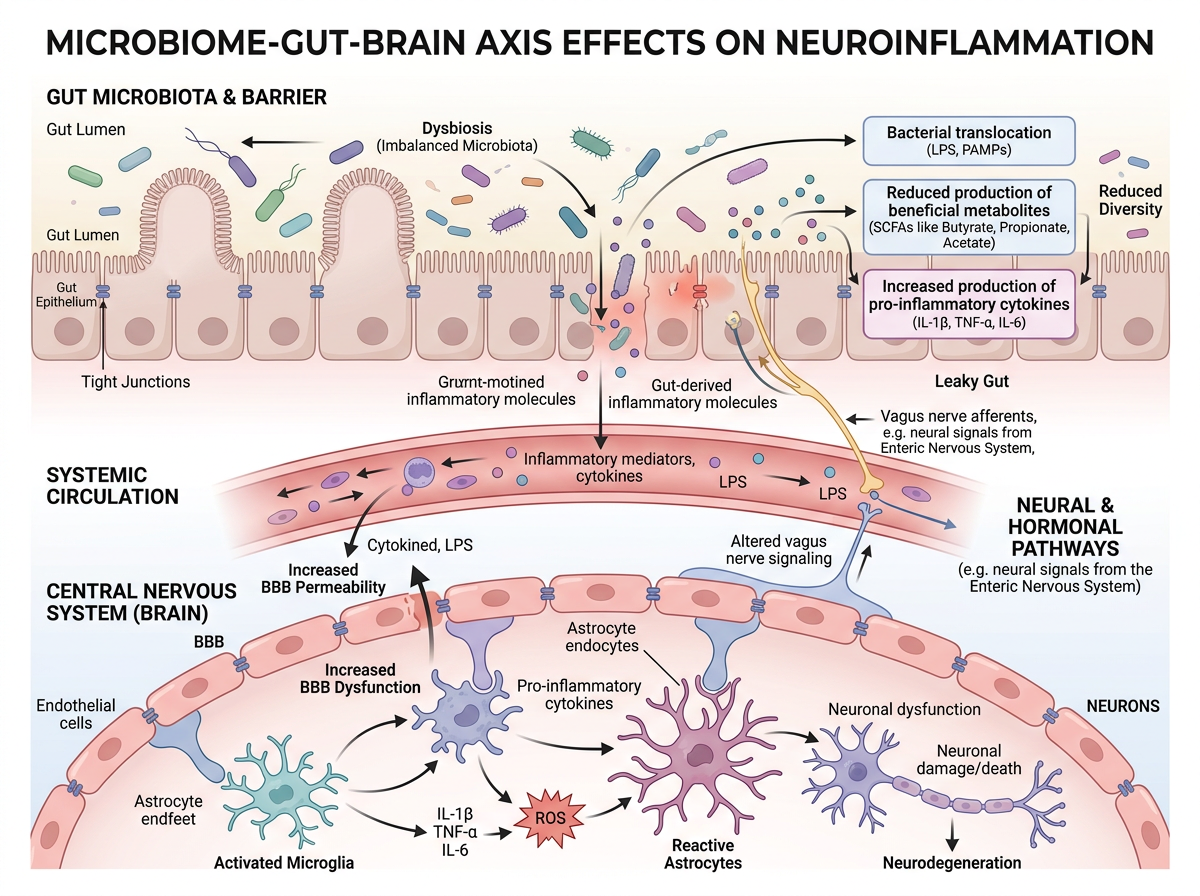
The microbiome–gut–brain axis template reads top to bottom through anatomy: gut microbiota and barrier, systemic circulation, then effects on microglia, astrocytes and neurons. Elsevier's page, opened today, prefers a clear start and end, "reading" from top to bottom or left to right; this is the top-to-bottom version of that advice. The soft-biomedical shading keeps one visual language across three tissues. There is an in-image title to remove for Elsevier, and a number of callout boxes — if the thumbnail looks crowded, keep the three tissue layers and drop the extra annotations first.
12. Input, device, output (a synthetic biology biosensor)
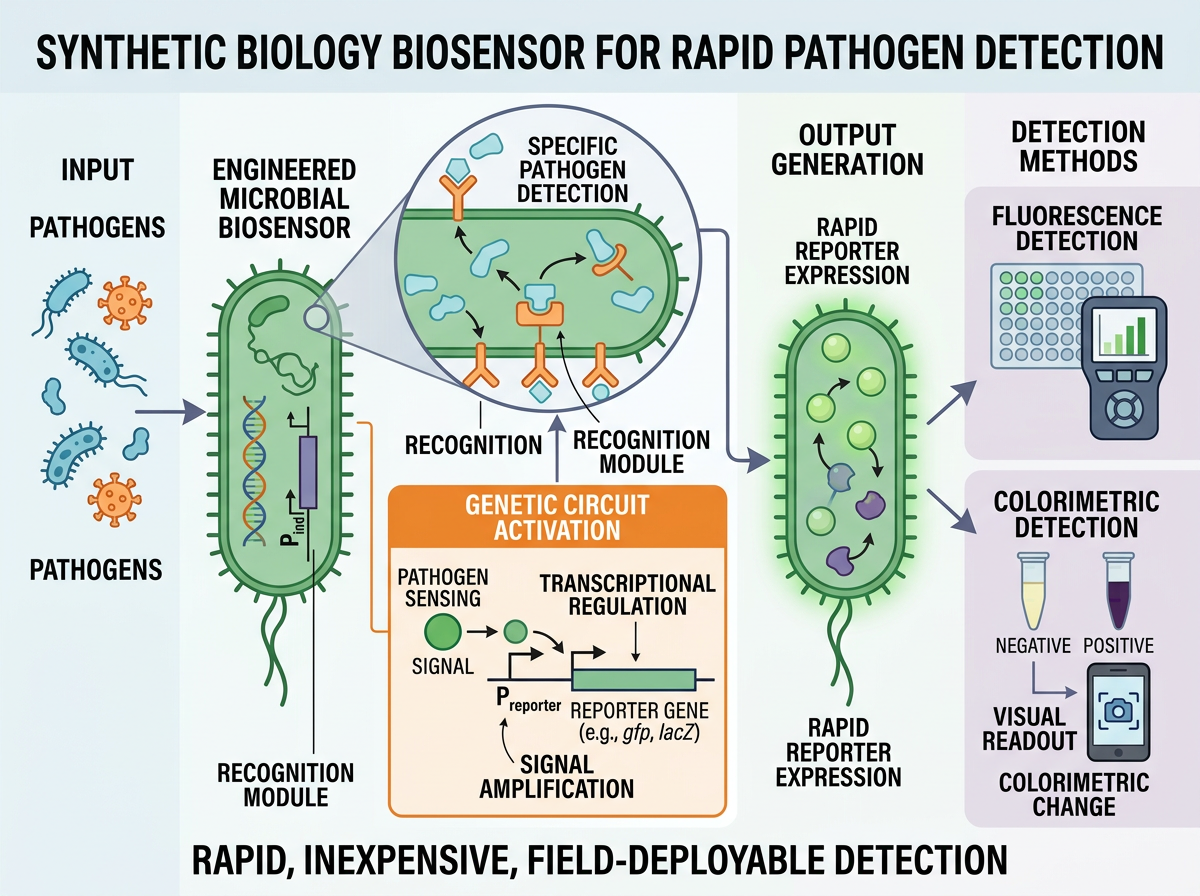
The synthetic biology biosensor template is a compact device story: input pathogens, an engineered microbial biosensor and genetic circuit, reporter output, and three detection methods (fluorescence, colorimetric, visual readout). Input → device → output is a strong pattern for a tool or assay paper, because the take-home message is what the device does, not every circuit detail. A one-line summary sits under the figure here ("rapid, inexpensive, field-deployable detection"); treat that as a caption you might move out of the image if the journal wants no extra text around the graphic.
What to copy from these 12 — and what to strip
- Match the shape to the journal before you fall in love with a layout. A square six-step workflow (example 1) and a wide lifecycle (example 2) are not interchangeable without redrawing. Check the target size first; our size guide and the graphical abstract template page are the starting points.
- Pick one message. Examples 8 and 12 are easier to read at a glance than examples 9 and 10, which try to be a review figure and a graphical abstract at the same time.
- Use a comparison or a loop only when that is the message. Example 7 earns its split layout; example 6 earns its closed loop.
- Remove gallery scaffolding. Titles, "graphical abstract" headings and spare white space should come out when the journal asks for that. Elsevier's page, checked on 20 November 2026, is explicit on the heading.
- Decide about plots. Curves and bar charts can stay in a results figure. They are a common reason a graphical abstract is sent back.
- Edit the labels. A template is a starting file, not a finished submission. Fix typography, drop unreadably small type, and do not leave placeholder text in the image.
If an AI tool helped you build the image, check the journal's disclosure rule and record what you used. Elsevier's generative AI policy for graphical abstracts is covered in our Elsevier graphical abstract requirements; templates for the caption, Methods and cover letter are in How to Disclose AI Use in Figures.
You can open any of the 12 templates in FigPad's graphical abstract maker, swap in your own study, and edit the labels on the canvas. FigPad exports layered SVG, PPTX and high-resolution PNG; layered SVG export is available on every plan, including Free (see the pricing page for current plans). Export last, to the pixel size and file type the journal actually asks for.
FAQ
Can I submit one of these gallery images as my graphical abstract? No. They are FigPad-generated layout examples, not images of your work. Journals ask for an original graphic that represents your paper. Use the layout, then redraw the content.
Why do some examples include a title in the image? It helps when you are browsing a gallery. Several journals, including Elsevier as of 20 November 2026, ask you not to put a "graphical abstract" heading or extra text outside the image content. Take the heading off before you submit.
Should a graphical abstract include dose-response curves or survival plots? Only if your journal allows data in that file. Some publisher guides ask you to keep data out of the graphical abstract and use it to tell the story of the paper instead. Check the guide for authors.
How small will the image actually be displayed? Elsevier states that ScienceDirect scales it into a 500 × 200 pixel window, and that type must stay readable at 200 pixels high. Other publishers use different shapes, but all of them show a thumbnail, not a full page. Test a reduced preview before you export.
