
Quick Start

Create, refine, and export your first scientific figure in FigPad. Start from text, a sketch, or a reference image and get an editable draft ready for papers and talks.

Try FigPad Free

Text to Figure

Describe a mechanism, workflow, or concept in plain language and generate a draft you can keep editing.
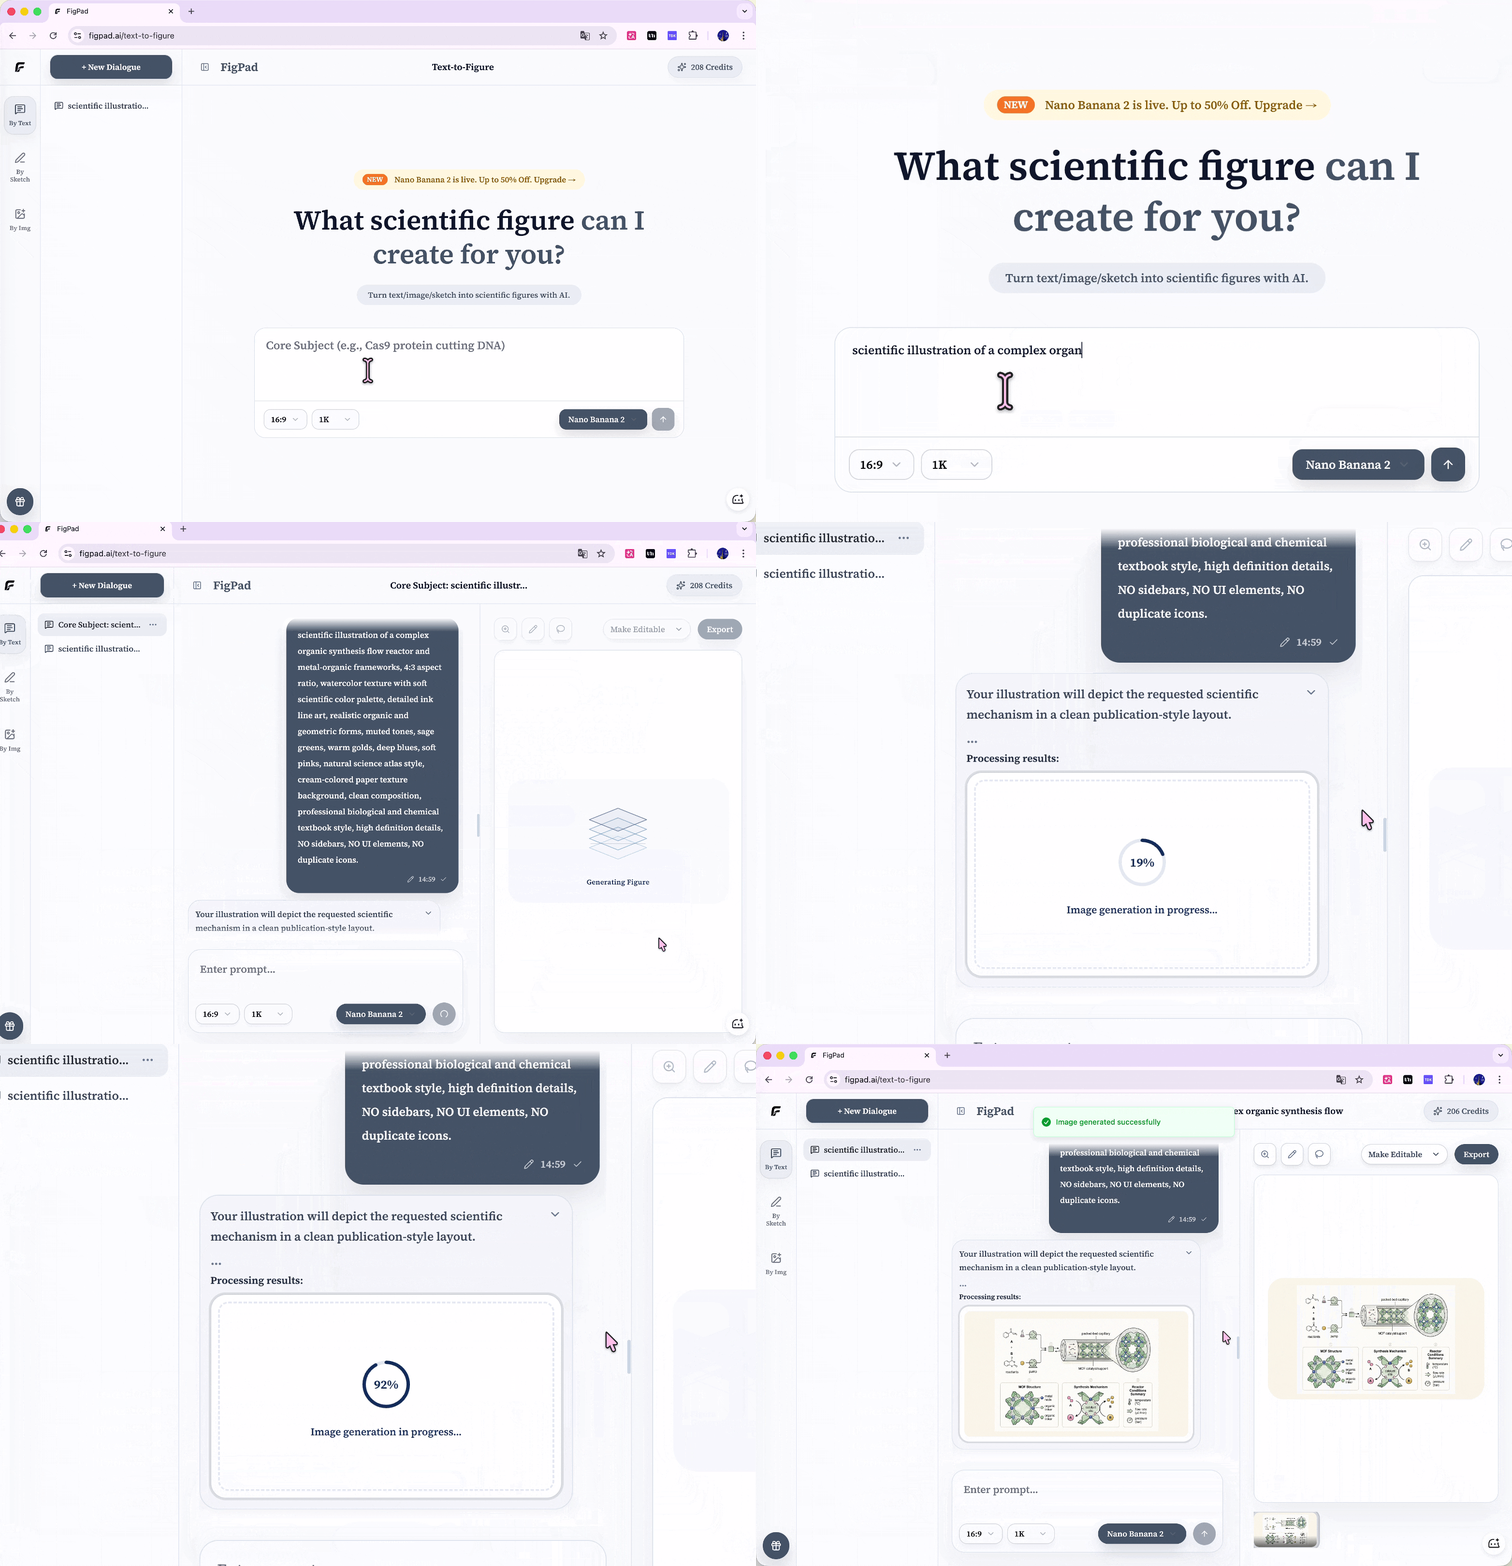
Generate a scientific figure from a text prompt

Step 1: Describe the figure

Open the workbench and write the subject, relationships, arrow direction, labels, and intended use. Example: “Cell signaling pathway with ligand binding, kinase cascade, and transcriptional response, flat vector style for a journal figure.” More specific prompts produce layouts closer to submission needs. Choose GPT Image 2 or Nano Banana 2 and set the aspect ratio.

Step 2: Refine in conversation

You do not need to rewrite the full prompt. Say “change the red module to blue,” “add a feedback-inhibition arrow on the right,” or “make the labels larger.” Use the lasso to redraw one region, or detect and edit in-image text while the rest stays put.

Step 3: Export the figure

When labels, color, and layout look right, export PNG / JPG for documents, or convert to editable SVG and PPTX for PowerPoint or Illustrator. Recheck scientific accuracy and the journal’s type size and resolution rules before submission.
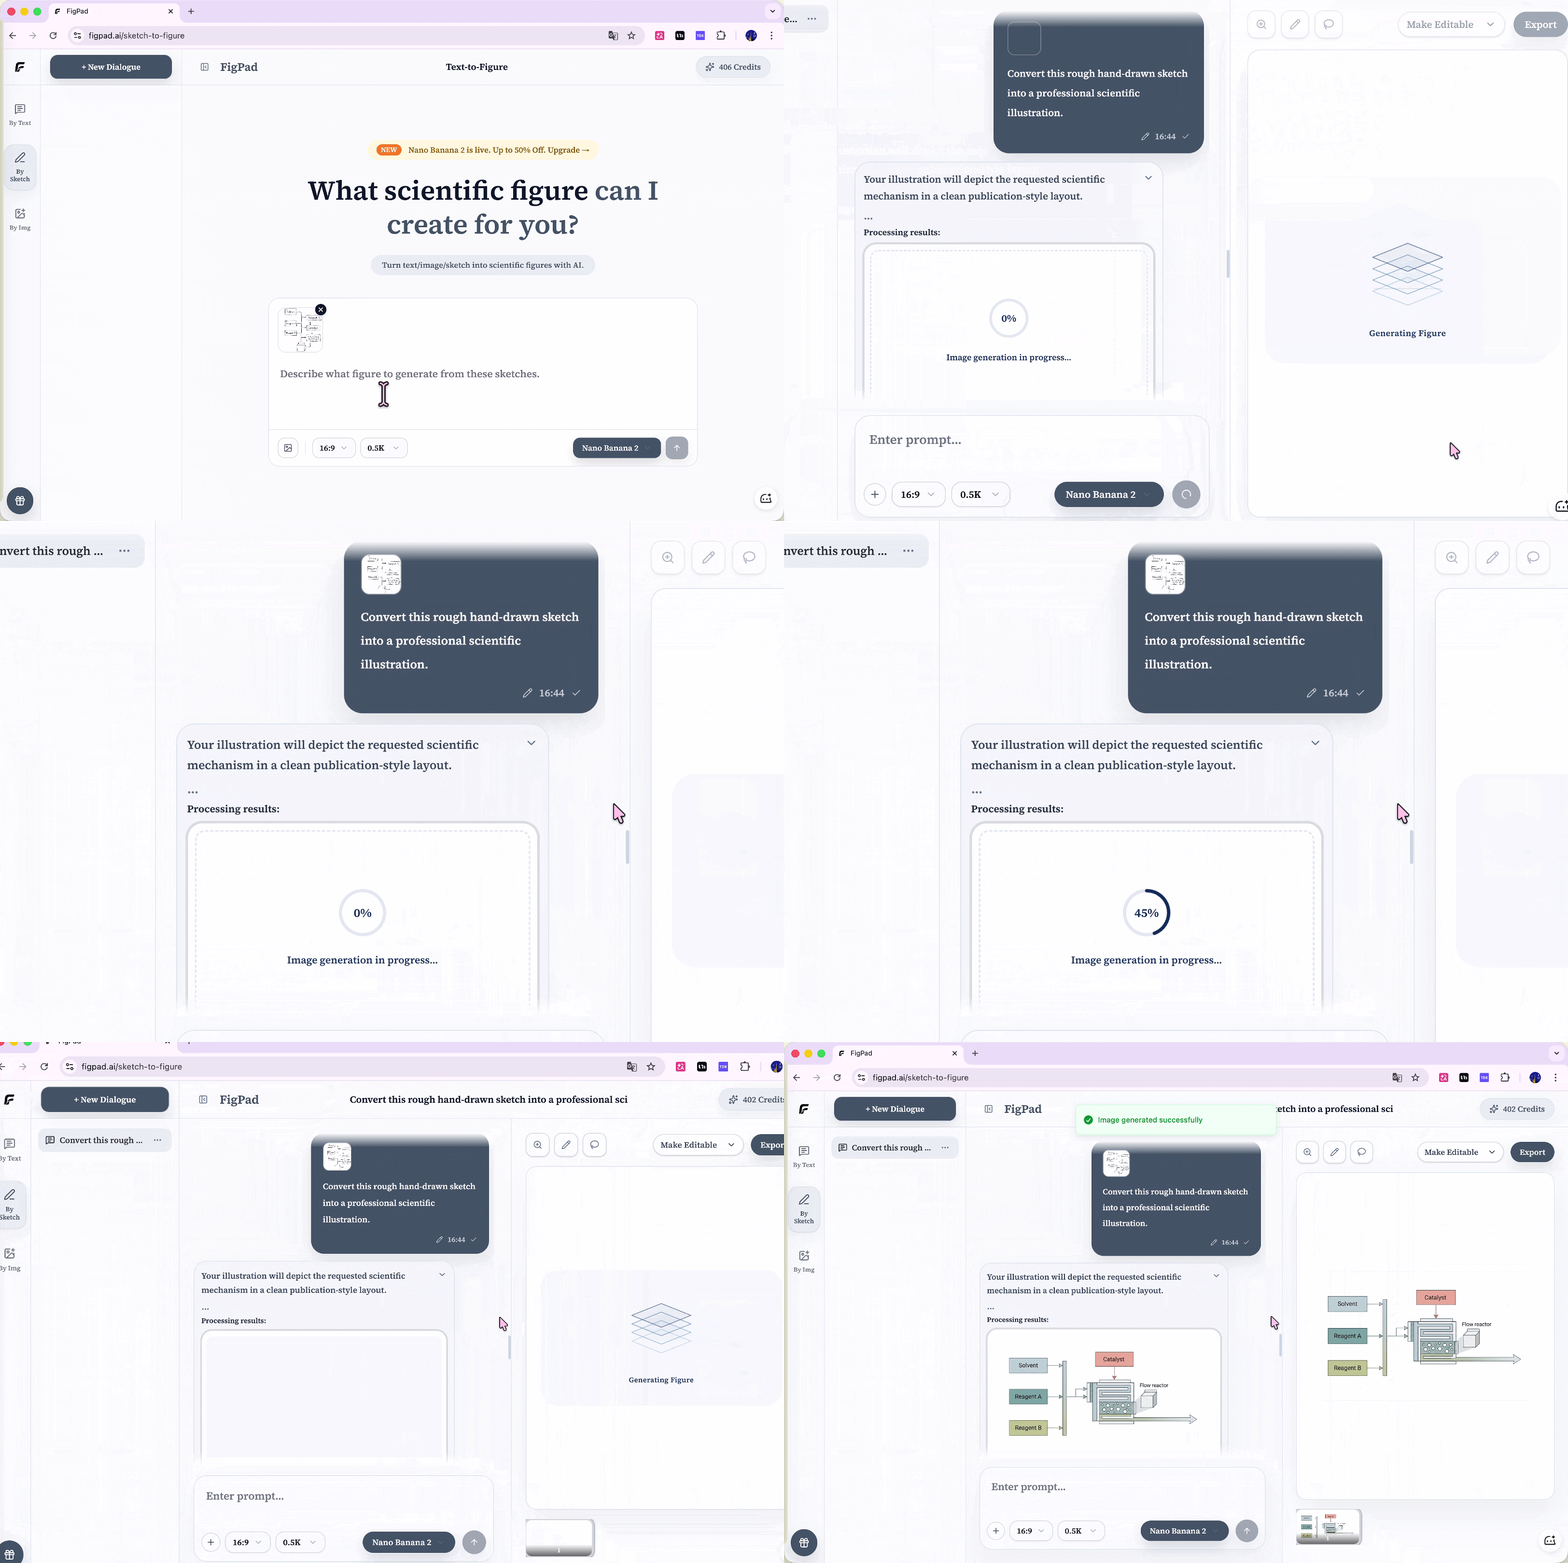
Sketch to Image

Upload a hand sketch, whiteboard photo, or low-fidelity block diagram. FigPad keeps the structure and fills in publication-ready detail.

Turn a hand-drawn sketch into a scientific figure

Step 1: Upload the sketch

Photograph a paper sketch, lab whiteboard, or rough flowchart and upload it. Module placement, arrow flow, and hierarchy guide the composition — you do not need a polished line drawing first.

Step 2: Describe what to generate

Say what the sketch represents: protocol steps, instrument connections, or a mechanism. Name the structure to keep and the labels, colors, and style you want added. Avoid uploading an image with no instructions.

Step 3: Polish and export

Compare the result with the original sketch. If a module is missing or an arrow is wrong, lasso that area. Then export a raster or vector file.

Reference to Figure

Borrow composition and color from a journal figure or graphical abstract, then generate a new figure for your own topic.

Step 1: Upload a reference

Pick a figure whose layout, palette, or information hierarchy you want to follow. The goal is visual language, not a copy of the original content.

Step 2: Write your own science

Describe the mechanism, workflow, or apparatus and the labels that must appear. FigPad uses the reference as a visual guide and rebuilds the scene around your content.

Step 3: Adapt, then export

Check that only the style was borrowed and the content is yours. Keep iterating with chat or regional edits, then export for a paper or talk.

Vectorizer

Turn a raster scientific figure into scalable, editable SVG, and export PPTX when you need slides.

Step 1: Start from the workbench or an upload

Convert a figure you just generated, or upload an existing PNG / JPG to the SVG converter. Clean lines and a simple background vectorize more reliably.

Step 2: Edit on the canvas

In the built-in SVG editor, change fill, stroke, and opacity, move or delete shapes, and add text or geometry. This is the place to fix label color and alignment before submission.

Step 3: Export SVG or PPTX

Export SVG for Illustrator and similar tools, or an editable PPTX for slides. Vector artwork stays sharp when you scale it up for a poster.

Paper to Poster

Upload a paper PDF, pick an academic template, and generate a structured poster you can still edit before presenting.

Step 1: Upload the PDF

Open Paper to Poster and upload the manuscript. FigPad reads the title, abstract, methods, and main results as the starting copy for each poster panel.

Step 2: Choose a template and generate

Pick a template for a conference or lab meeting. You can still revise key findings, captions, and author details after generation.

Step 3: Tighten before you present

Shorten long paragraphs, check figure callouts and units, then export for print or screen. Treat the poster as a presentation draft, not automatic final layout.

Features

AI Scientific Figure Generator

Four entry points cover the usual research-visual workflow, then you refine and export in the same workbench.

  • Text to Figure: Generate a first draft of a mechanism, workflow, apparatus figure, or graphical abstract from a written description.
  • Sketch to Image: Upload a hand sketch or low-fidelity layout and keep the module relationships while filling in detail.
  • Reference to Figure: Upload a journal figure or abstract you like and generate a version that fits your own topic.
  • Paper to Poster: Upload a PDF and generate an academic poster you can still edit.

Image Generation Models

Switch models in the workbench. Each balances prompt following, in-image text, aspect ratio, and speed differently.

  • GPT Image 2: Default model with stronger prompt following and clearer in-image text. Best for pathway and labeled mechanism figures. Supports 1:1, 3:2, 2:3, or auto.
  • Nano Banana 2: Google Gemini image model, faster for exploring composition and alternate directions. Supports 16:9, 4:3, and 1:1.

Conversational Iteration

The first image is rarely the last. FigPad treats generation as a conversation so the model remembers the current figure.

  • Edit the latest version: Ask for color, label, arrow, or layout changes without restating the full prompt.
  • Compare versions: Move between versions in the same thread and keep the one closest to submission quality.
  • Projects save automatically: Conversations and images stay in workbench history so you can continue later.

AI Image Editing

When most of the figure is right, change only the part that is not.

  • Lasso redraw: Select a region, describe the change, and regenerate only that area.
  • In-image text edit: Detect labels and notes, then fix a term or typo without regenerating the whole figure.
  • Aspect ratio: Generate at a ratio the selected model supports, for single-column, double-column, or slide layouts.

Export

Pick a format for a paper, slide, or poster, then do a final check before you submit.

  • PNG / JPG: Drop into Word, LaTeX, or slides for drafts and routine talks.
  • SVG vector: Scale without blur and edit shapes or colors in Illustrator or the built-in canvas.
  • Editable PPTX: Keep editing text and layout in PowerPoint for lab meetings and defenses.

Vectorization and Canvas

Rasters are fast to review. Vectors are better for relabeling, recoloring, and large prints.

  • Raster to SVG: Convert a generated or uploaded image to vector paths. Each conversion costs 4 credits.
  • Built-in canvas: Change fill, stroke, and opacity, add text or shapes, and move or delete elements.
  • Downstream tools: Continue layout in PowerPoint, Illustrator, and similar apps after export.

Inspiration Gallery

Browse compositions, palettes, and diagram patterns researchers already use instead of starting from a blank prompt.

  • Browse by type: Common categories include workflows, mechanisms, graphical abstracts, and lab apparatus.
  • Reuse prompts: Open a figure to see its source prompt, copy it, and adapt it to your topic in the workbench.

Share Your Work

Create a link when a colleague needs to see the process or the result.

  • Public link: Anyone with the link can view the conversation and images, but they cannot edit your project.
  • Password access: Require a password before opening the share. Use this for unpublished data.

Credits & Pricing

Why Upgrade?

The free trial is enough to learn the workflow. Upgrade when you need more credits, vector export, or higher-resolution output.

  • More credits: Buy a one-time pack or a subscription so you are less likely to stop mid-figure.
  • Higher-resolution export: Higher plans unlock 2K / 4K output for posters and journal systems.
  • Vectors and canvas: Choose a plan that includes SVG, editable PPTX, and the built-in canvas when you need them.

How Credits Work

Credits meter generation, editing, and vectorization. You are charged per action, not per word. Remaining credits are always visible in the top-right of the workspace.

  • Generate a figure: Each text, sketch, or reference generation costs 2 credits.
  • Convert to SVG: Each raster-to-vector conversion costs 4 credits.
  • Invite a colleague: When someone joins through your link, you both receive 4 credits.
  • Trial credits: New accounts receive trial credits and do not need a card to start.

Plans

FigPad offers one-time credit packs, monthly plans, and yearly plans. Check the pricing page for current quotas, storage, and export limits.

  • One-time packs: Best for occasional paper figures or graphical abstracts. Purchased credits stay available long-term.
  • Monthly / yearly: Better for ongoing personal or lab use. Yearly billing is usually cheaper.
  • See full pricing: Compare Starter, Plus, and Pro credits, storage, and export options on the pricing page.
See full pricing

FAQ

Features

  • How far does sketch-to-figure go?: You can upload hand sketches, structure drafts, flowcharts, or low-fidelity layouts. It is best for locking module relationships and arrow direction before you polish detail — especially for mechanism figures and graphical abstracts.
  • Does reference-to-figure copy the original?: No. It borrows composition, color, and visual language, then rebuilds the figure around your science so you can move a journal style onto your own topic.
  • Can I still change text, color, and layout?: Yes. Continue in chat, or use lasso and in-image text edit for local changes instead of redrawing from scratch.
  • Can I edit vectors in PowerPoint or Illustrator?: Yes. Export SVG or editable PPTX, then keep adjusting type, color, and layout. Scaling up for a poster stays more stable.
  • Can I use results in papers and talks?: Yes, for paper figures, abstracts, posters, and presentations. Before formal submission, still check labels, type size, contrast, and export size against the target journal.

Credits

  • How are credits deducted?: Generating a figure costs 2 credits. Converting to SVG costs 4. Remaining credits appear in the top-right of the workspace.
  • What if I run out?: Buy a one-time pack, upgrade to monthly or yearly, or invite a colleague — you both receive 4 credits.

Account

  • Is my research data secure?: Prompts, uploads, and generated figures stay in your workspace unless you share them. Follow your institution’s rules for unpublished or regulated data.
  • Where do I get invoices?: After signing in, open billing settings and download invoices from payment history.

Glossary

Core Concepts

  • Prompt: The instruction you give the AI to generate or edit a figure. Naming structure, labels, color, and use case gets you closer to scientific communication.
  • Conversation context: In one thread the model remembers the current figure, so you only need to describe the incremental change.
  • Hallucination: When the AI draws an extra bond, the wrong cell structure, or another unsupported detail. Fix the region with the lasso, or put critical labels in the prompt.

Generation Modes

  • Text to Figure: Generate entirely from a written description when you have a clear concept but no existing visual.
  • Sketch to Image: Render a hand sketch or whiteboard photo into a fuller scientific figure while keeping the original structure.
  • Reference to Figure: Use an existing image as a style and layout guide, then generate a new figure for your topic.
  • Paper to Poster: Extract structure from a PDF and generate an academic poster draft you can still edit.

Editing and Export

  • Lasso edit: Redraw only the selected area. Use it when 90% of the figure is right.
  • In-image text edit: Recognize text on the figure and change a label without regenerating everything.
  • Vectorization: Convert pixels into paths so the figure can scale and be edited piece by piece.
  • Credits: The meter for generation and vectorization. Generation costs 2 credits; SVG conversion costs 4.

Still have questions? Contact us

Start your next figure.

Join researchers from leading institutions who are already using FigPad to create editable scientific figures.

Start for Free