

"Editable SVG" is the most oversold phrase in scientific figure tools. An SVG file is only editable in the way you need if the text inside it is still stored as text and each shape is still a separate object. Run a PNG through a generic auto-tracer and you get a file with the .svg extension whose labels have become outlined paths — visually identical, functionally dead. This matters at exactly one moment: when a reviewer asks you to rename a protein, fix a unit, or correct a typo in panel C. A layered SVG turns that into a double-click. An outlined one turns it into a redraw. This guide covers what "layered" means concretely, a 30-second test for any file you're handed, and the honest news that SVG is a working format — not the file Nature or Elsevier want you to upload.
The moment "editable" gets tested
Nobody notices the difference at export time. Every format looks right in the preview. The difference shows up six weeks later, in a decision letter, in a sentence like: "The authors should clarify that the pathway in Fig. 2b refers to NLRP3, not NLRP1."
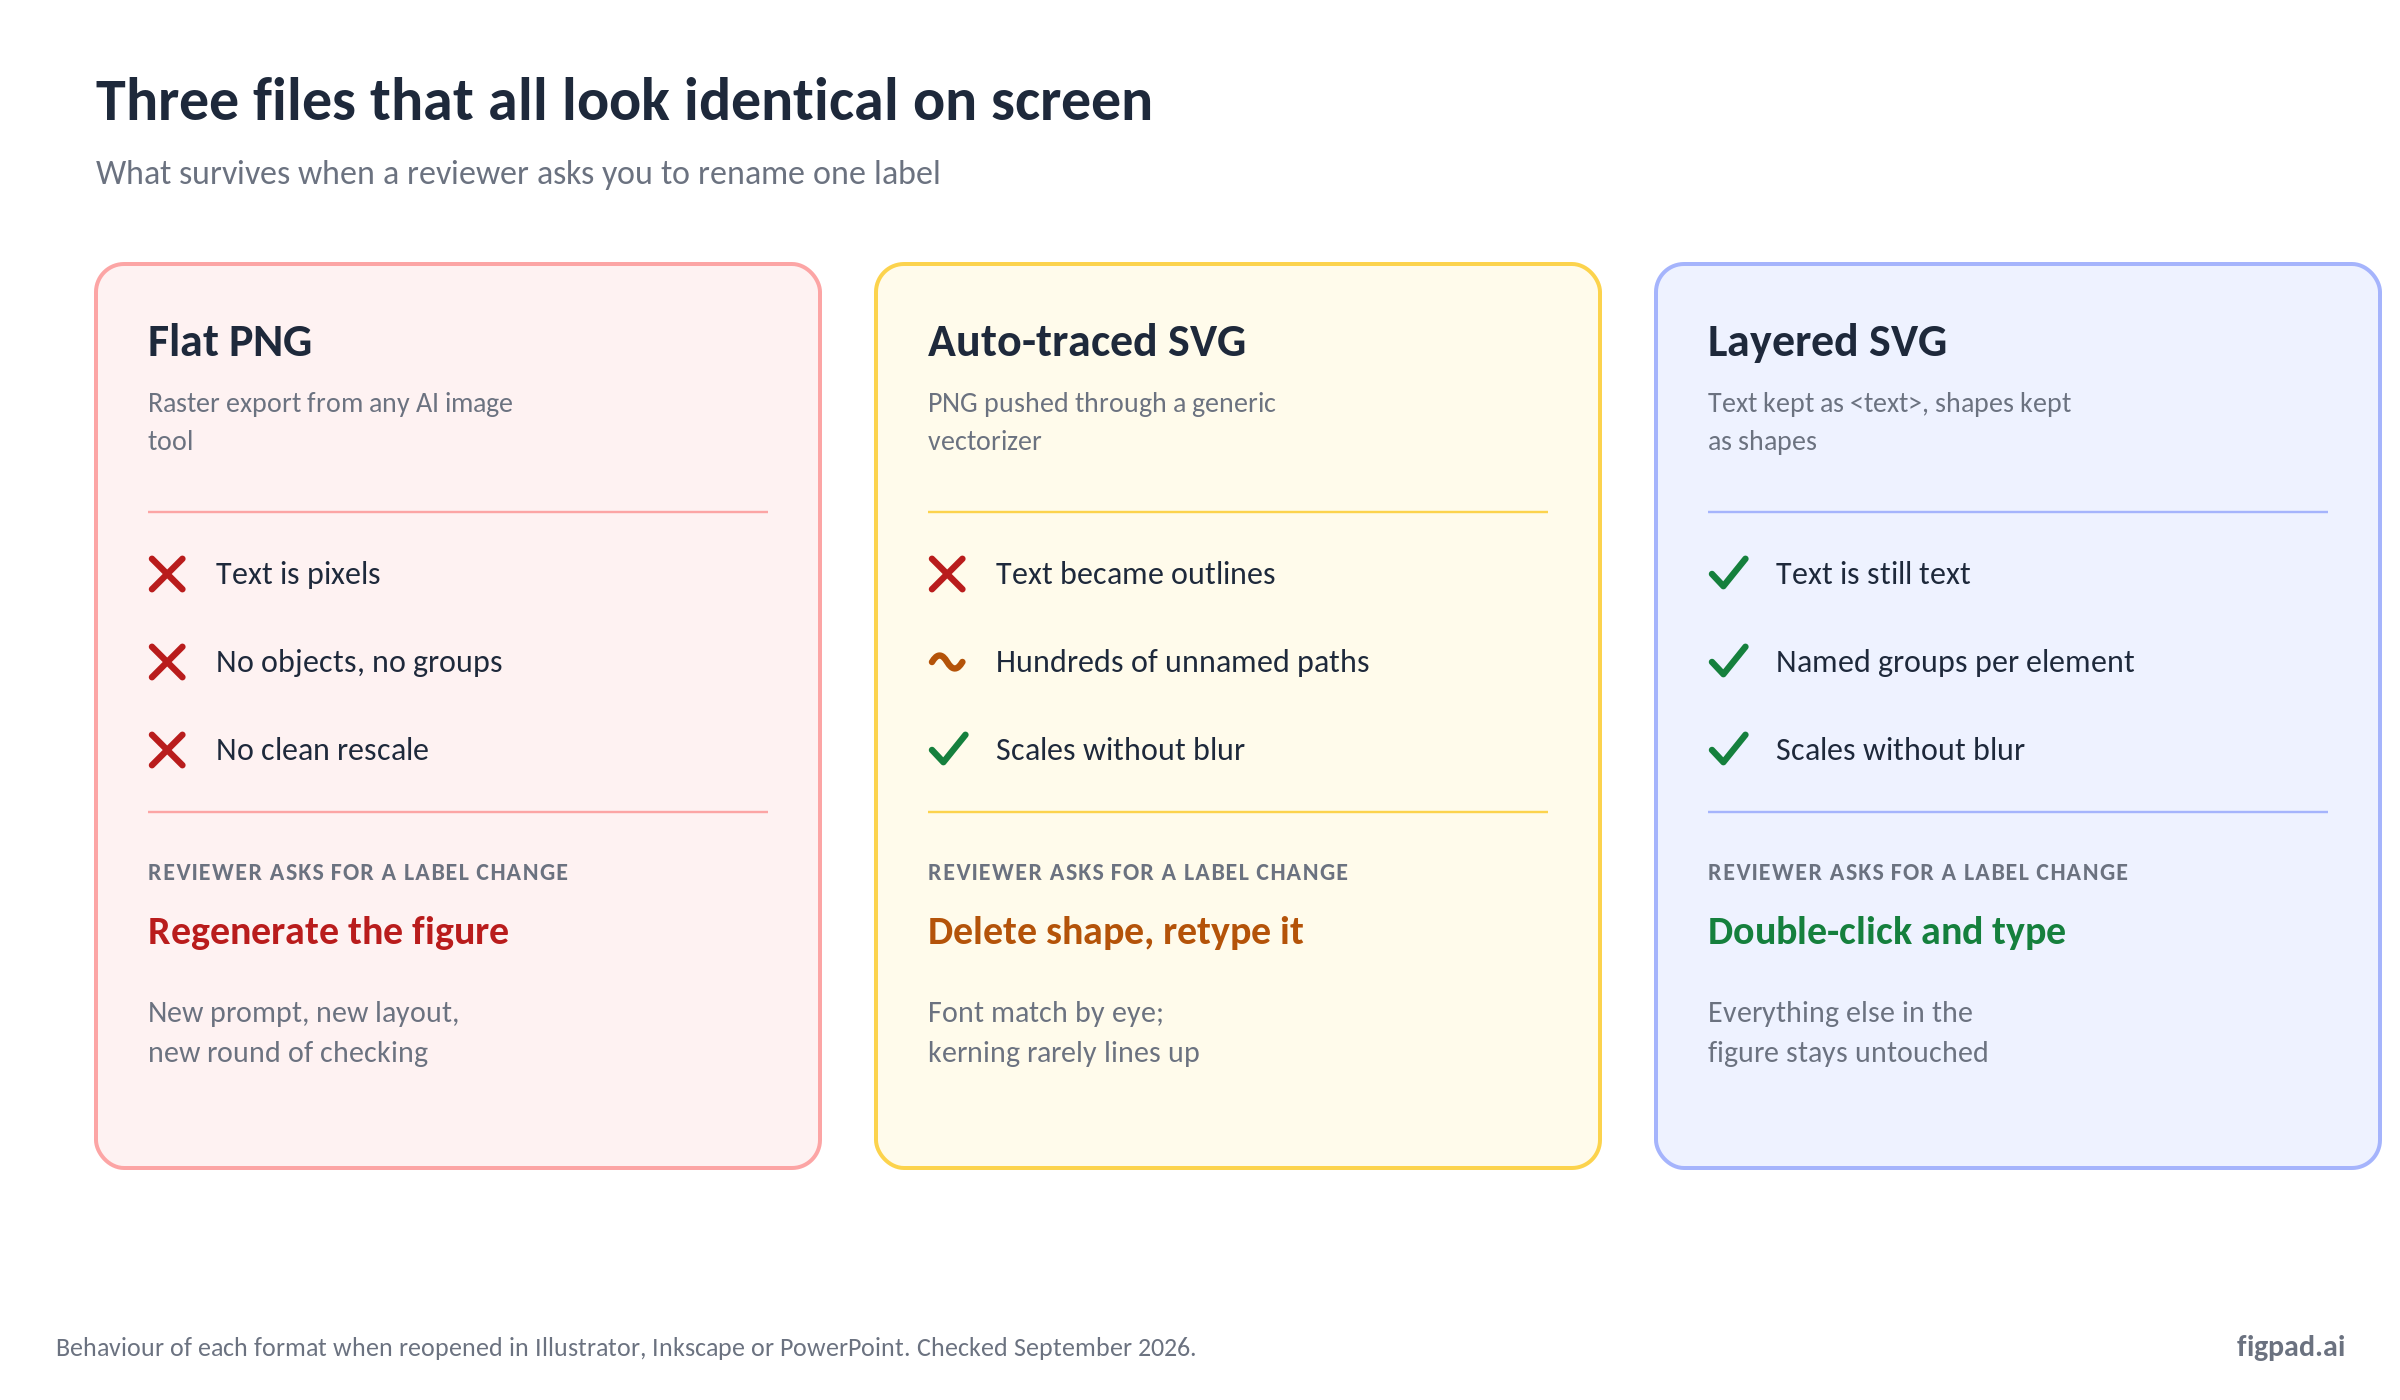
That's a nine-character fix. What it costs you depends entirely on a decision you made before you'd even submitted. If your figure is a flat PNG, you go back to the generator, re-prompt, and accept that the new output won't match the old layout — which means re-checking every other label in the figure too. If your figure is a traced SVG, you delete an outlined shape and retype the text, then try to match the original font and kerning by eye. If your figure is a layered SVG, you open it, double-click the label, type, and re-export. Everything else in the figure is untouched, which also means nothing else needs re-checking.
The asymmetry is the whole argument. Revisions aren't a one-time event — a typical paper goes through two or three rounds, each generating a handful of small textual corrections. Pay the structural cost once, at generation time, and every round afterwards is cheap.
What "layered" means in the actual file
SVG is XML. If you open one in a text editor, you can read it. That's the useful property, and it's also how you audit a file you've been handed.
A genuinely layered scientific figure has four characteristics:
Text is stored as <text> elements. The string "Mitochondrion" appears literally in the file, with a font-family attribute next to it. Any editor — Illustrator, Inkscape, Affinity, even a browser — will let you click it and retype it. The failure mode is text stored as <path>: the letterforms are preserved as geometry, the words are gone.
Shapes are primitives or clean paths, not a mosaic. An arrow is one path with a marker, not forty overlapping polygons that happen to look like an arrow. A cell membrane is a closed path you can recolor in one click, not a stack of traced color bands.
Elements are grouped and named. <g id="panel-b-labels"> tells you and your editor that these objects belong together. Without grouping, moving one panel means rubber-band-selecting a few hundred anonymous shapes and hoping you got them all.
Nothing is a rasterized fallback. Watch for an embedded <image> tag with a base64 blob inside. That's a PNG wearing an SVG costume — very common in exports from tools that vectorize only the outer shell.
The 30-second test for any SVG you're handed
You don't need a vector editor to check this, and you shouldn't take a vendor's word for it.
- Open the file in a browser, then use Find (Ctrl/Cmd+F) and search for a word you can see in the figure. If the browser highlights it, the text is real text. If Find comes up empty, it has been outlined.
- Open it in a plain text editor and search for
<text. Count the hits and compare against the number of labels you can see. A figure with fourteen visible labels and zero<text>nodes has been flattened. - Search for
base64. Any hit means part or all of the figure is an embedded raster. - In a vector editor, click one label. If the selection handles wrap a single object you can type into, you're fine. If clicking selects a shape that turns out to be half of a letter "R", the file is traced.
Test 1 alone catches most of the fakes and takes about five seconds. Do it on any figure a collaborator sends you before you build a paper around it.
Layered SVG is your master file, not your submission file
Here's the part most tool marketing skips, and it's worth being blunt about: SVG is usually not the format you upload to a journal.
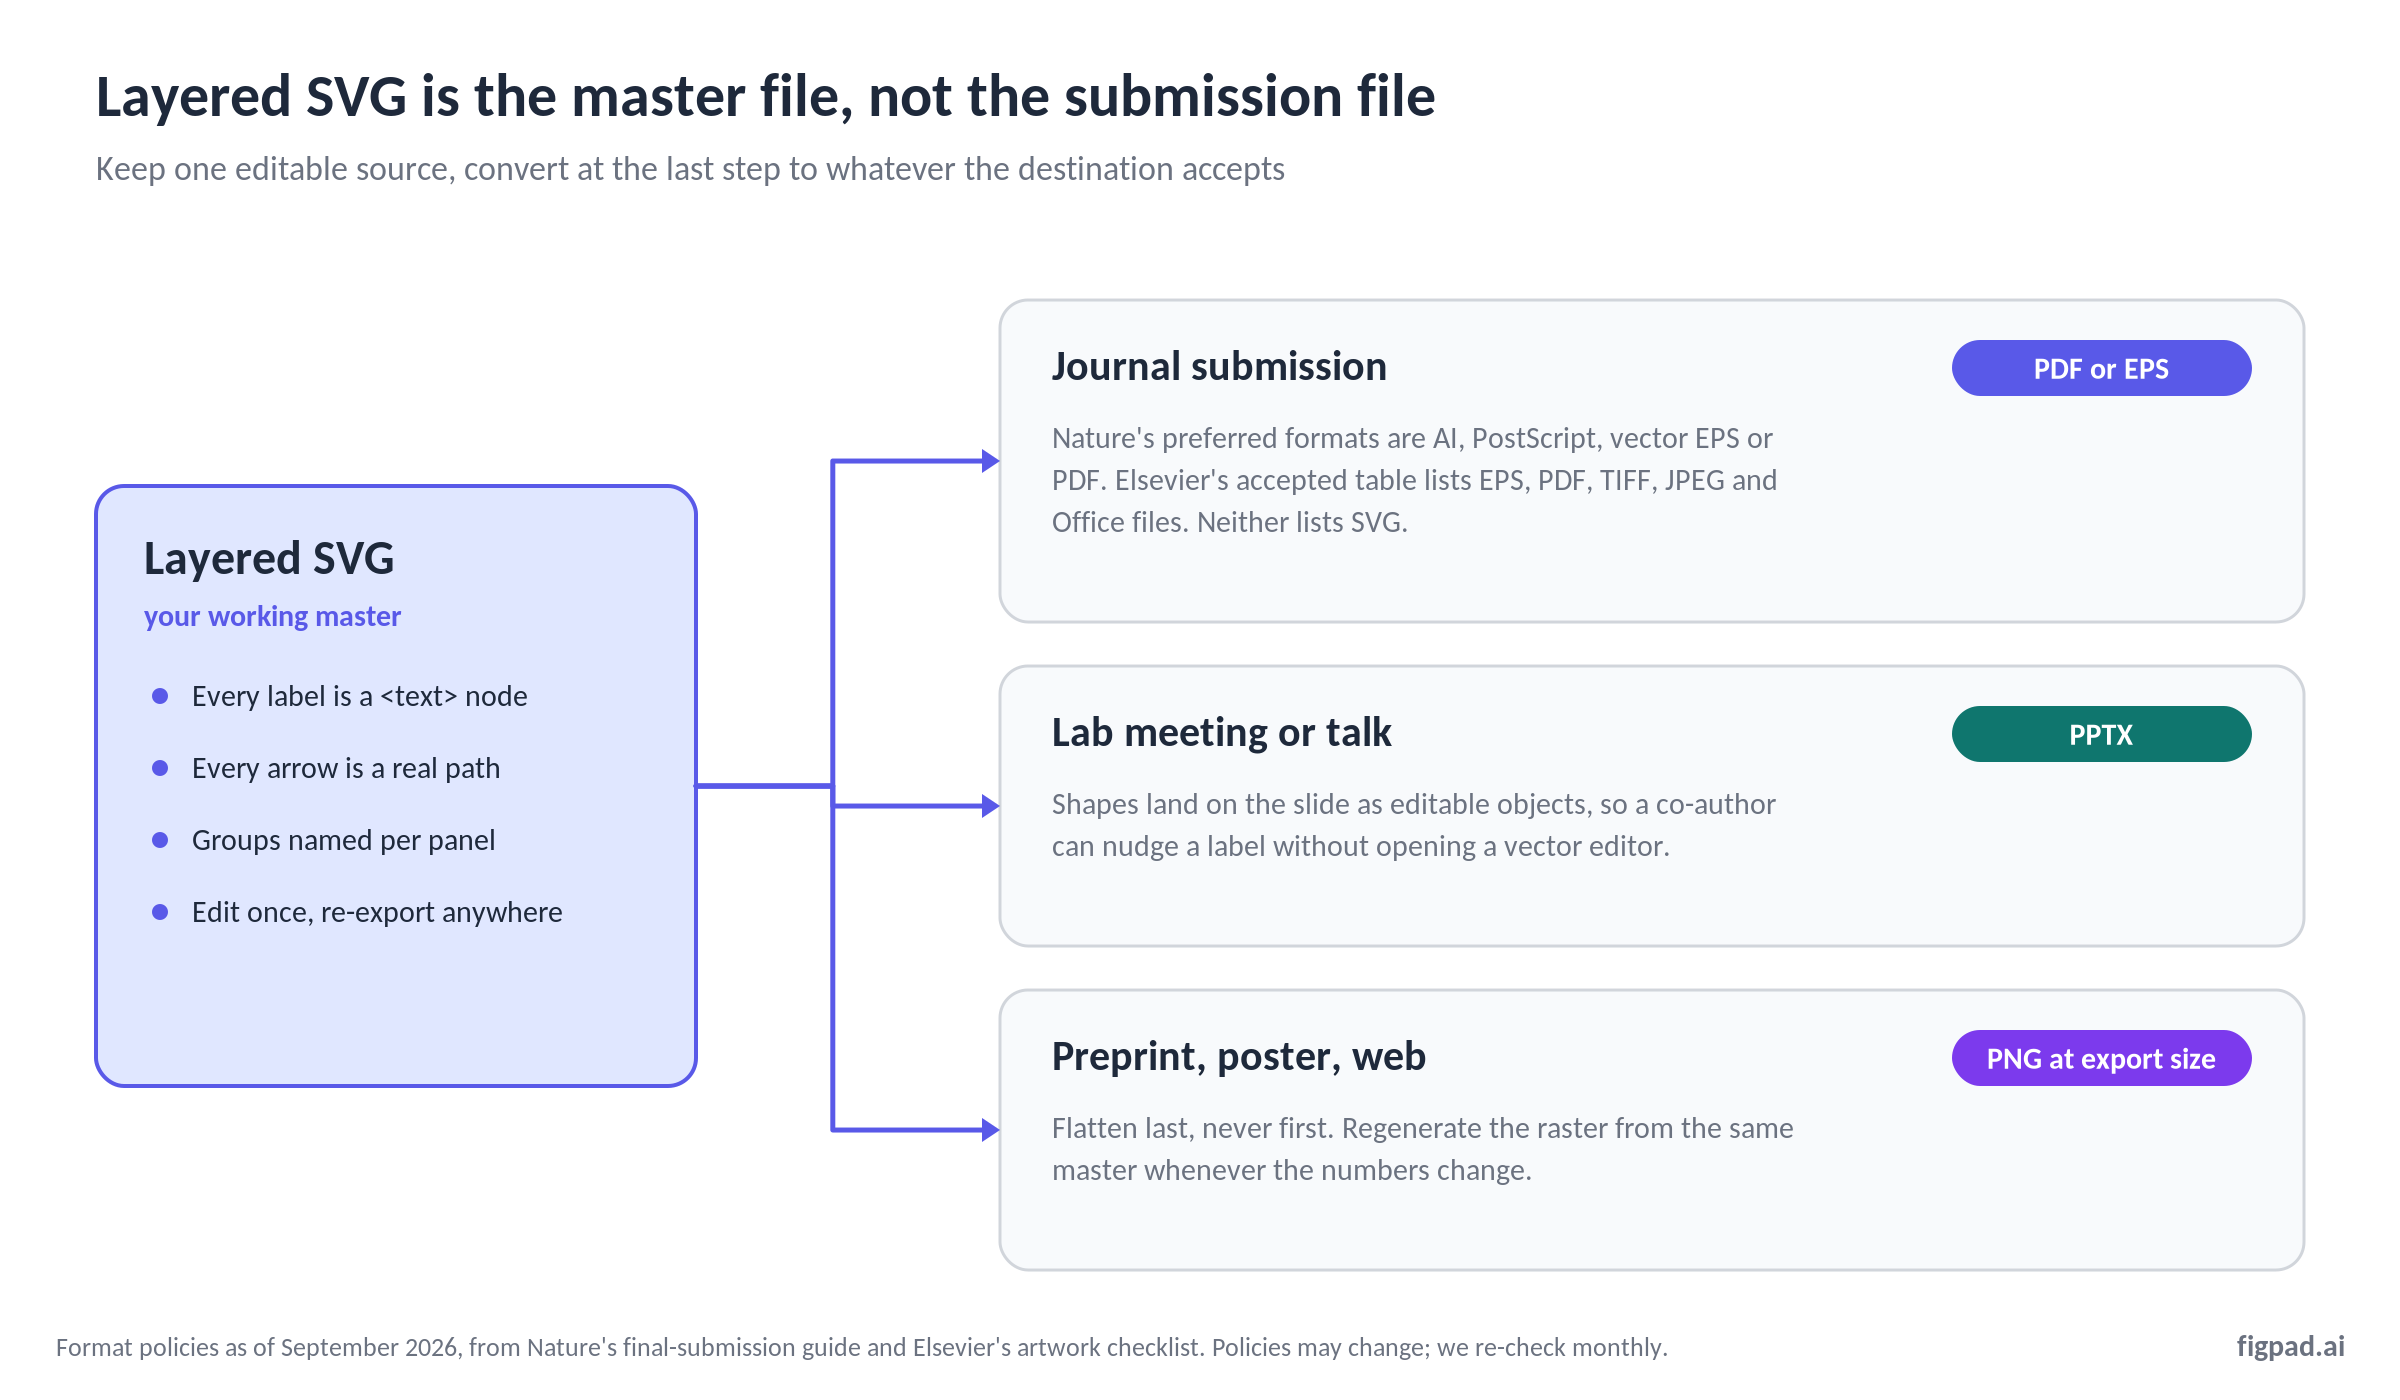
As of September 2026, Nature's final-submission guide names its preferred formats for line drawings and graphs as Adobe Illustrator (AI), PostScript, vector EPS, or PDF — and instructs authors plainly: "Please do not rasterize line art or text in submitted figures and wherever possible supply editable, unflattened vector artwork," along with "Do not rasterize or covert text to outlines." Elsevier's artwork formats checklist lists TIFF, JPEG, EPS, PDF, and Microsoft Office files as accepted, with EPS named the preferred format for vector graphics. Neither table has an SVG row.
That is not a contradiction of everything above. It's the correct mental model:
- Layered SVG is the master you keep, edit, and hand to co-authors.
- PDF or EPS is the derivative you generate at submission time, with fonts embedded.
- PNG or TIFF is the flattened derivative for preprints, posters, and slides.
Every one of Nature's specific figure rules is easier to satisfy when your master is still editable: lettering in a sans-serif face (Helvetica or Arial preferred), maximum text size 7 pt with a 5 pt floor at final size, panel letters at 8 pt bold, line weights between 0.25 and 1 pt at final size, and figures built to 89 mm single-column or 183 mm double-column width. You cannot adjust any of those in a PNG. You can adjust all of them in a layered SVG in about ten minutes.
Elsevier adds a font constraint that bites people who design in whatever typeface looked nice: stick to Arial/Helvetica, Courier, Symbol, or Times/Times New Roman, and embed all fonts on export, or Elsevier may substitute the font — which can produce missing symbols and overlapping type. Again: fixable in a master, not in a flattened export.
Format comparison, as of November 2026
| Source | Vector export | Is text still text? | Structure you get | Journal-ready path |
|---|---|---|---|---|
| FigPad (every plan, including free) | Layered SVG, plus PPTX | Yes — labels stay as editable text objects | Named groups per element; in-canvas editing | Convert master to PDF/EPS; PNG/JPG at the resolution the model generates |
| BioRender | None. Help centre states "There is no vector export option at this time" | N/A | N/A | PNG/JPEG for all users; PDF for Premium; 600 DPI Premium only |
| Adobe Illustrator | Native AI, EPS, PDF, SVG | Yes, unless you outline it yourself | Full layer control, manual | Direct — this is the reference implementation |
| Inkscape | Native SVG; exports PDF and EPS | Yes | Full layer control, manual | Direct, with an export step |
| Generic auto-tracers | SVG | No — text becomes outlined paths | Hundreds of unnamed paths | Technically vector, practically unmaintainable |
Sources: BioRender Help Centre, "Exporting file formats in BioRender" (page updated 9 September 2026; re-checked 2026-11-02), FigPad pricing, and the vendors' own documentation. Prices and features checked 2026-11-02; prices and feature tiers may change; we re-check monthly.
The BioRender row deserves a note, because it's easy to read as a dunk and it isn't one. BioRender's icon library and biological accuracy are genuinely the best in the category, and its export limitation is a deliberate product decision tied to how its assets are licensed. If you need a scientifically vetted receptor at 300 DPI this afternoon, BioRender is still the fastest route there. It just isn't the route to a file you can restructure later.
How FigPad fits
FigPad exists because of the specific gap in the table above: tools that generate good-looking figures fast usually hand you something you can't restructure, and tools that hand you something you can restructure usually make you draw it yourself.
The FigPad workflow starts from a prompt, a whiteboard sketch, or a reference image, and produces a figure on an editable canvas — every label a text object, every shape selectable. You can see the generation side on the AI scientific figure generator page and the editing side on the scientific figure creator page. If what you have is a bitmap — a figure from an old thesis chapter, a screenshot of a hand-drawn schematic — the Vectorizer rebuilds it as a layered SVG where text stays text and arrows stay arrows, rather than welding everything into one traced blob.
Two details matter for the revision workflow specifically. Layered SVG export is available on every plan, including free, and on the credits side, editing an element inside the canvas costs nothing — you're only charged for generations (2 credits), text corrections (2 credits), and SVG exports (4 credits, with re-exports of the same version free). A full generate-edit-export cycle runs about 16 credits. That pricing shape is deliberate: fiddling with a figure until it's right shouldn't be metered. Plans start at $12/month billed yearly; Plus is $20/month billed yearly or $29 month-to-month, Pro is $29/month billed yearly or $49 month-to-month, and one-time credit packs start at $12 for 95 credits that never expire (prices checked 2026-11-02). The current numbers are on the pricing page, and if you're comparing against a tool you already use, the BioRender alternative page lays the two side by side.
When a layered SVG isn't the right answer
Being honest about the limits is more useful than another feature list.
Stay with BioRender if your figure's value is in standardized, peer-recognizable biological iconography and you don't anticipate structural changes. A perfectly correct cell diagram you never need to restructure doesn't benefit from being editable.
Stay with Illustrator or Inkscape if you already own the skills. Nothing generated will give you the control a competent vector editor gives you, and Inkscape costs nothing. The trade is time, not quality — that's the honest framing.
Skip vector entirely for photographic content. Micrographs, gels, blots, and histology are raster data and must stay raster. Nature wants layered PSD or TIFF at 300–600 DPI for photographic images, and vectorizing a micrograph isn't just unnecessary, it's a data-integrity problem. A hybrid figure — photographic panels placed inside a vector layout with vector labels — is the correct construction.
Don't bother if the figure is genuinely single-use. A schematic for one lab meeting slide that will never be submitted anywhere does not need a maintainable master.
And one thing worth saying regardless of tool: some journals ask authors to disclose AI-assisted figure creation. Check your target journal's policy, and never present a generated illustration as primary experimental data.
Key Takeaways
- "SVG" is not the same claim as "editable." Text stored as
<path>is outlined, not editable — the extension tells you nothing. - Test it in five seconds. Open the SVG in a browser and Ctrl/Cmd+F for a visible word. No highlight means no real text.
- SVG is the master, not the submission. As of September 2026, neither Nature's nor Elsevier's accepted-format lists include SVG. Convert to PDF or EPS with embedded fonts at the last step.
- Layered structure pays for itself at revision round two. The cost of an editable master is paid once; the cost of a flat figure is paid every time a reviewer touches a label.
- Vector isn't universal. Micrographs, gels, and blots stay raster at 300–600 DPI. Build hybrids: raster panels, vector labels.
