
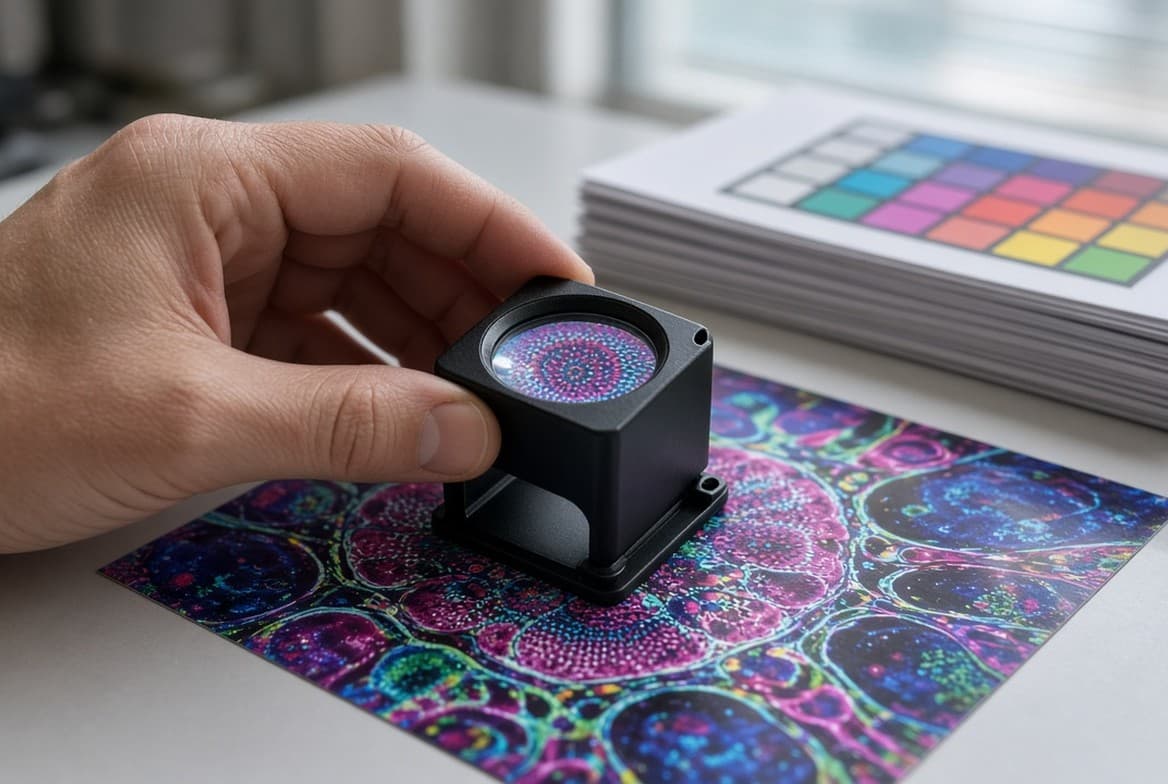
Your target journal's artwork page does not say "300 DPI" and stop there. Nature asks for Illustrator, EPS or PDF for anything containing line drawings, and 300–600 dpi TIFF only for photographic images. Cell Press wants 1,000 dpi for line art, 500 for black and white, 300 for colour — each measured at the desired print size. Elsevier wants 1,000 dpi line art (1,200 if the strokes are very fine), 300 for halftones, 500 for combination art. Cambridge publishes 1,000, 300 and 600 for the same three categories. PLOS accepts only TIFF or EPS at 300–600 dpi, under 10 MB. Six publishers, six different tables — and not one of those numbers means anything until you fix the print width. This guide gives you the 2026 specifications as published, the arithmetic that turns them into a pixel count, and the cases where exporting vector makes the question disappear.
"300 DPI" is not a requirement — it is one row in a table
The reason the 300 dpi folk rule keeps failing at submission is that it answers a question nobody asked. Three things have to be true at once for a raster figure to pass: the right artwork category, the right resolution, and the right print width. The folk rule covers one of them, for one category.
Categories are where most rejections start. Publishers sort artwork into roughly three buckets — pure line art (diagrams, schematics, plots, anything made of strokes and text), halftone (photographs, micrographs, gels, anything with continuous tone), and combination art (a micrograph with labelled arrows and an axis, which is most real figures). Each bucket has its own number, and the combination bucket — the one your figure almost certainly falls into — is never 300.
The second trap is the phrase every publisher attaches and most authors skim past: at the desired print size. Cell Press writes it into every line of its spec. Elsevier's sizing page repeats it. It means the DPI value in your export dialog is irrelevant on its own. A file is 2,000 px wide; whether that is 570 dpi or 267 dpi depends entirely on whether it runs in one column or across the page.
The 2026 numbers, as the publishers actually print them
Line art: 600 to 1,200, and most publishers would rather you sent vector
Elsevier asks for a minimum of 1,000 dpi for bitmap line art, and 1,200 dpi "if the image contains very fine line weights." Cell Press asks for 1,000 dpi at the desired print size. Cambridge asks for a minimum of 1,000 dpi and wants line illustrations as TIFF or vector EPS. IEEE is the outlier at the permissive end: greater than 600 dpi for black-and-white line art.
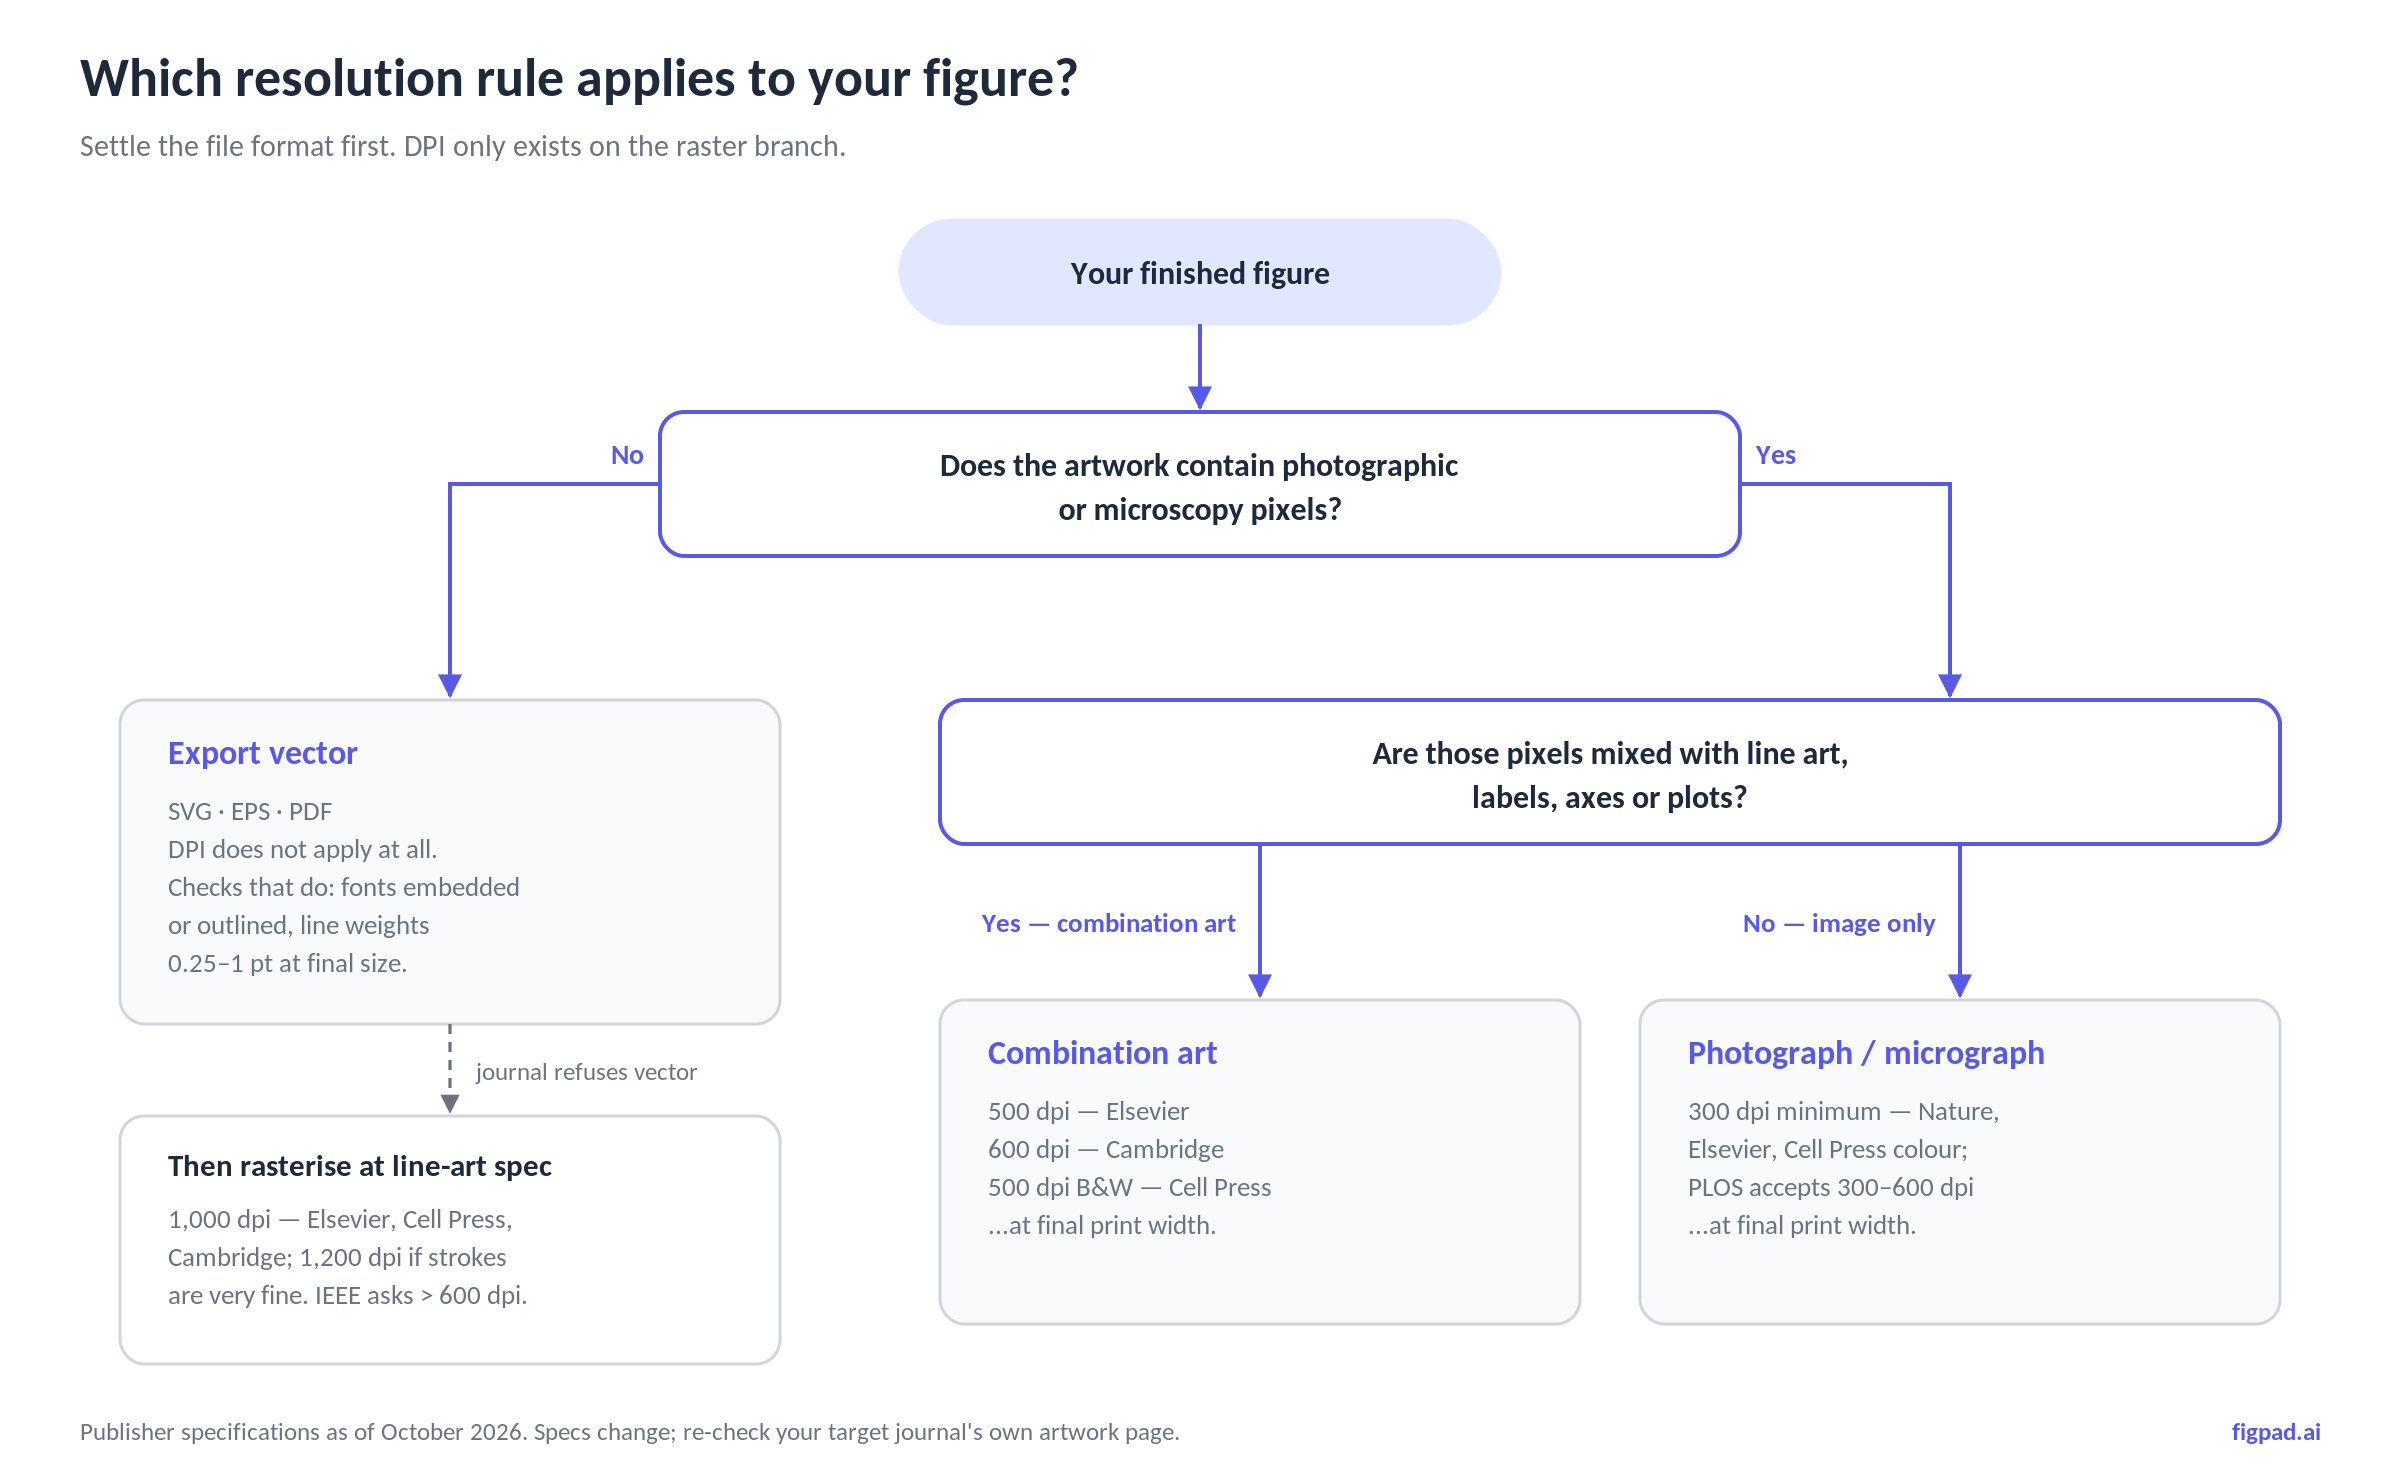
Nature does something more instructive — it does not publish a line-art DPI at all. It asks for Illustrator, Postscript, vector EPS or PDF for figures containing line drawings, and names the formats it will not take (Canvas, DeltaGraph, Tex, ChemDraw, SigmaPlot), telling you to convert those to Postscript, EPS or PDF first. The absence of a number is the point: for line art, the publisher's preferred answer is that resolution should not be part of the conversation.
Halftone and colour: 300 is close to universal
Here the folk rule holds up. Nature wants a minimum of 300 dpi at the maximum size the image can be used. Elsevier wants 300 dpi for both greyscale and RGB colour. Cell Press wants 300 dpi for colour and 500 for black and white. PLOS accepts 300–600 dpi, with hard pixel ceilings: minimum width 789 px, maximum width 2,250 px, maximum height 2,625 px, file under 10 MB, TIFF or EPS only, RGB or greyscale, flattened, LZW-compressed, no alpha channels.
That PLOS list is worth reading twice, because it is the shape of modern artwork checks: the DPI number is one line among nine, and the other eight fail you just as hard.
Combination art: the number nobody agrees on
This is the bucket most papers actually submit, and the one with the least consensus. Elsevier specifies 500 dpi. Cambridge specifies 600 dpi. Cell Press approaches it from the other side with 500 dpi for black and white. If you have been told "600 dpi for anything with text on it," you have been told Cambridge's number and applied it to everyone.
Elsevier also documents the hybrid route: an EPS containing both, at "300 (500) dpi for halftones and 1,000 dpi for line art." That is the technically correct answer for a labelled micrograph — raster pixels for the image, vector paths for the labels — and it is exactly what a layered file gives you.
DPI is a ratio, not a property of your file
A pixel has no physical size. DPI only appears when you divide a pixel count by a print width, which is why the only useful form of the rule is arithmetic:
pixels across = print width in inches × required DPI
Nature's single column is 89 mm — 3.50 inches. At 300 dpi that is 1,051 px across, which any phone screenshot clears. Nature's double column is 183 mm, 7.20 inches; at 600 dpi it is 4,323 px. Elsevier's double column is 190 mm, 7.48 inches; at 500 dpi combination spec that is 3,740 px, and at the 1,000 dpi line-art spec it is 7,480 px across. Cell Press at full width (174 mm, 6.85 inches) and 500 dpi needs 3,425 px.
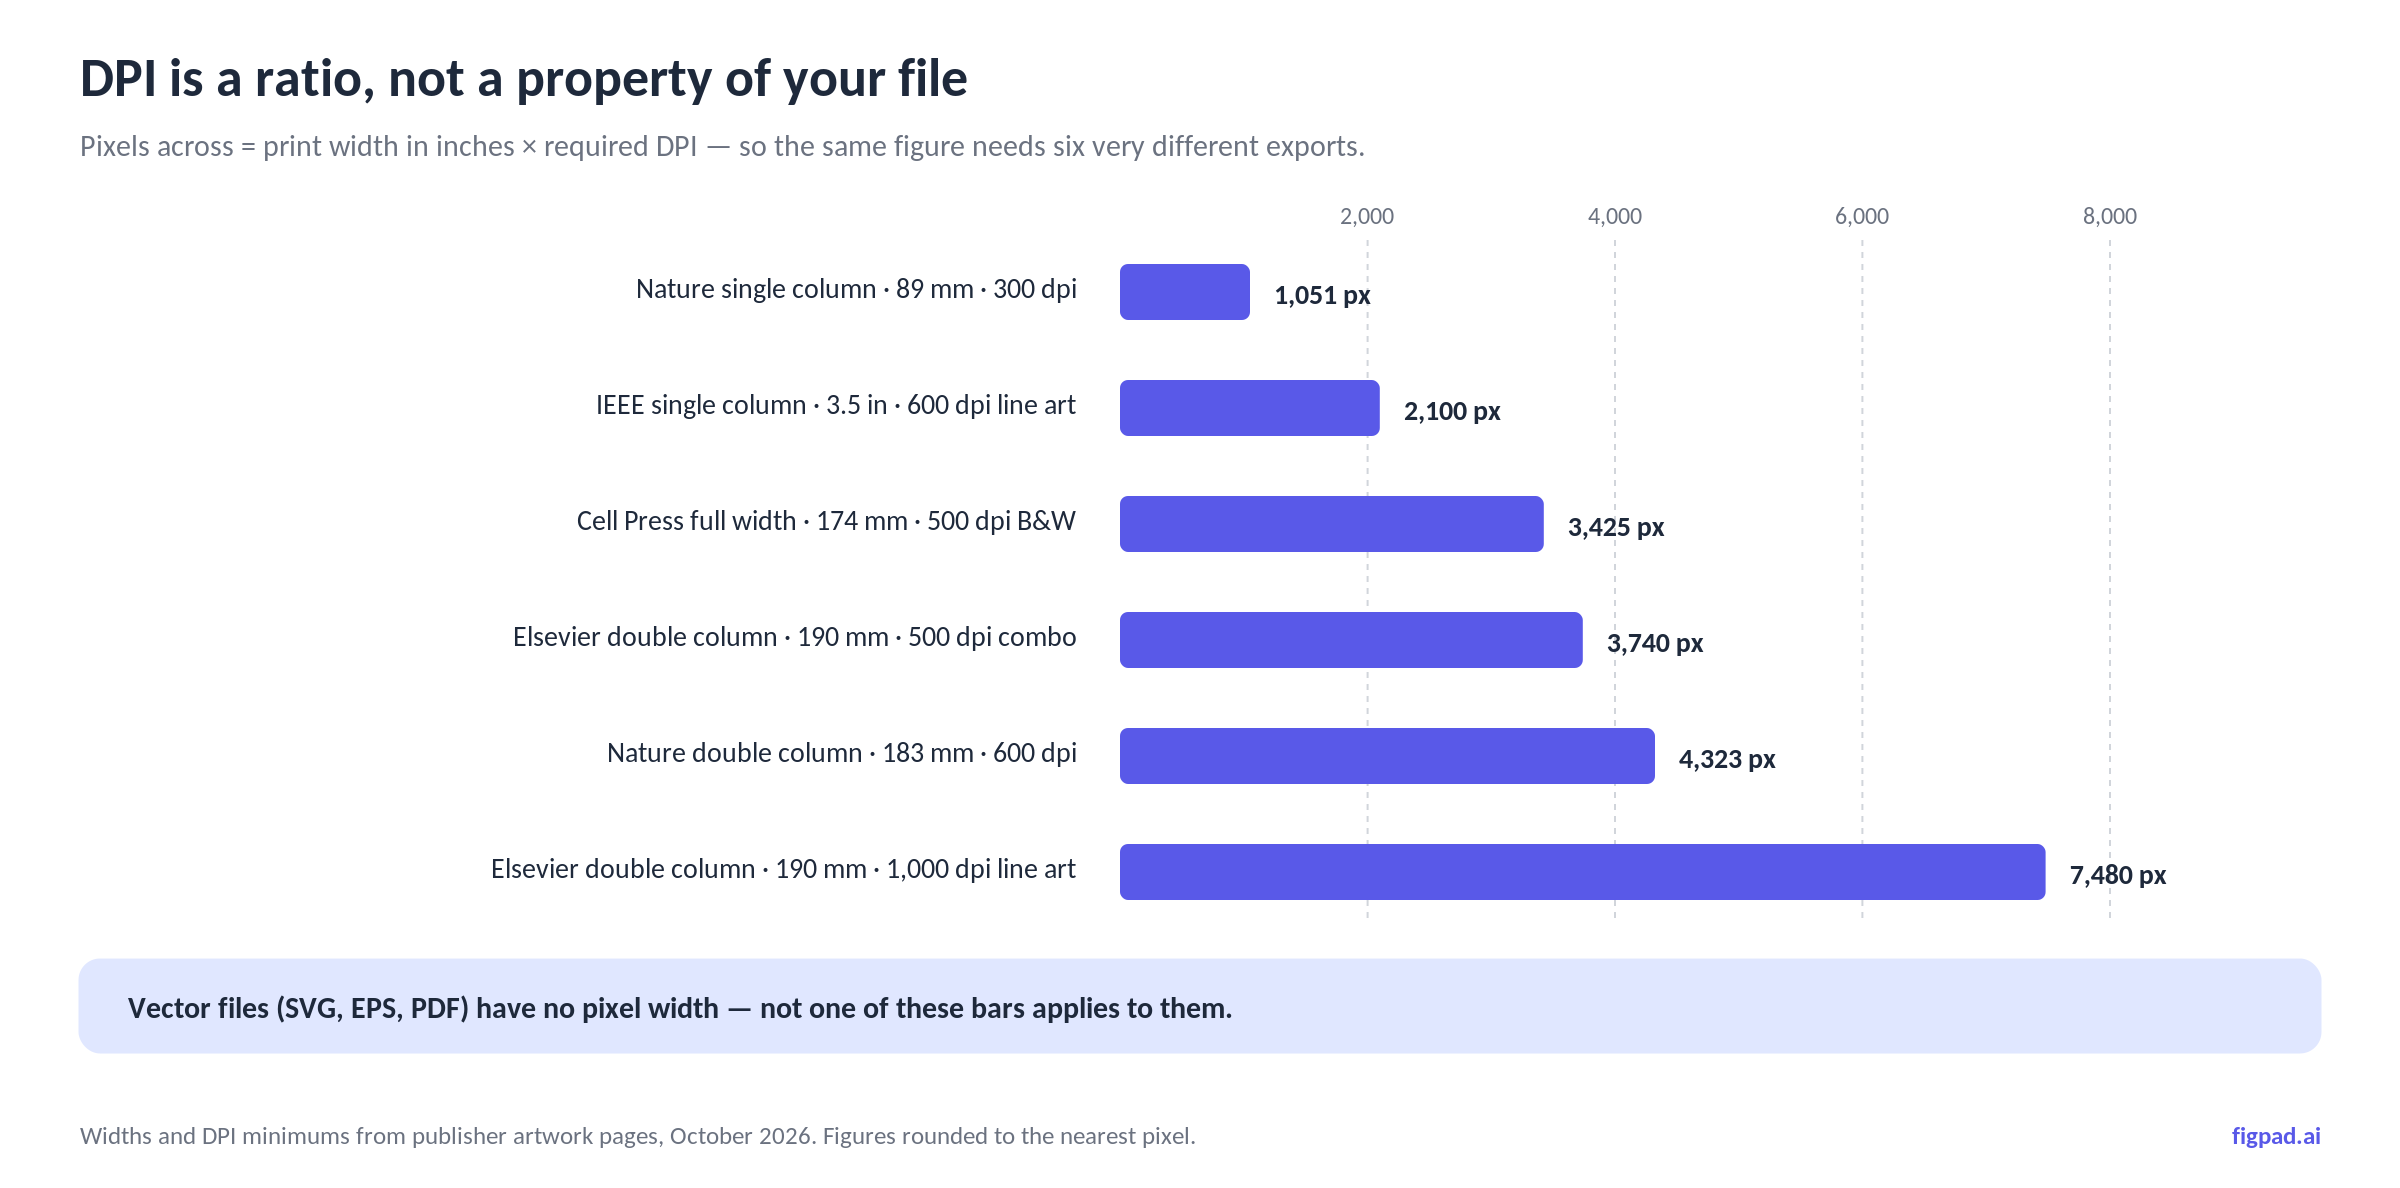
Two things fall out of that chart. First, the gap between the easiest and hardest spec is roughly sevenfold in width — about fiftyfold in pixel count and file size. Second, there is no single export setting that satisfies all six. Deciding you will "export everything at 600 dpi" produces files that are simultaneously too small for Elsevier line art and absurdly oversized for a single-column panel.
The practical move is to decide the print width before you draw, not after. If you know the figure runs single-column in a Nature-family journal, you are designing inside 89 mm, your 7 pt type has to be legible at 89 mm, and your line weights live between 0.25 and 1 pt at that size. Designing at some arbitrary canvas size and scaling at the end is how 7 pt labels become 4 pt labels.
Publisher requirements compared (as of October 2026)
| Publisher | Line art | Halftone / photo | Combination | Vector accepted | Single column |
|---|---|---|---|---|---|
| Nature | No DPI given — send vector | 300 dpi min (300–600 TIFF) | Not separately specified | AI, EPS, PDF, Postscript | 89 mm (183 mm double) |
| Cell Press | 1,000 dpi | 300 dpi colour, 500 dpi B&W | 500 dpi B&W | PDF, EPS at submission | 85 mm (174 mm full) |
| Elsevier | 1,000 dpi (1,200 fine strokes) | 300 dpi | 500 dpi | EPS, no DPI minimum | 90 mm (190 mm double) |
| Cambridge | 1,000 dpi min | 300 dpi min | 600 dpi min | Vector EPS, PDF | Varies by journal |
| PLOS | 300–600 dpi, TIFF or EPS only | 300–600 dpi | 300–600 dpi | EPS | Max width 19.05 cm |
| IEEE | > 600 dpi | > 300 dpi | > 300 dpi | Yes | 3.5 in (7.16 in double) |
Specifications read from each publisher's own artwork page in October 2026. Specs change; we re-check monthly, and your target journal may override its publisher's defaults — the journal's own author guide wins.
Where vector ends the argument
Look at the Nature row again. No line-art DPI, because a vector file has no pixels to count. The renderer draws the paths at whatever resolution the press plate needs, so a 40 KB SVG prints identically at 89 mm and on an A0 poster.
That is why "when does vector win" has a short answer: whenever your figure contains no photographic pixels. Pathway diagrams, mechanism schematics, experimental setups, flow charts, CONSORT diagrams, graphical abstracts — none of them contain continuous-tone data, so none of them should be shipped as raster. Sending a 7,480 px TIFF of a diagram is solving a problem you created by rasterising it in the first place.
Vector has its own checklist, and it is shorter but unforgiving: fonts must be embedded or converted to outlines (a missing font is the single most common vector rejection), line weights must sit between 0.25 and 1 pt at final size, transparency and blend effects often flatten unpredictably at the printer, and text must still be text if the journal wants to check it. The honest caveat is that labelled micrographs are genuinely hybrid — the image is raster, the annotation is vector — and Elsevier's hybrid EPS spec exists precisely for that case.
How FigPad fits
FigPad was built around the thing this article keeps circling: the file you submit is not the file you finish. A reviewer asks you to rename a label, swap a condition, or redraw an arrow, and whether that costs you five minutes or an afternoon is decided by what came out of your export dialog months earlier.
Generating from a prompt, a sketch or a reference image with the AI scientific figure generator produces a layered result rather than a flat picture. Layered SVG means text is still text and arrows are still arrows — open it in FigPad's canvas, Illustrator or Inkscape and change one element without disturbing the rest. That is the format Nature, Cambridge and Elsevier all prefer for line art, and it is the format that survives revision. Layered SVG export is available on every plan, including free; the pricing page lists current credit costs.
For the raster route, PNG and JPG download at the resolution the model generates, which is where the arithmetic above earns its keep: check the exported pixel width against your widest likely print width and required DPI, and switch to the vector master when it falls short. PPTX export drops the figure into slides as editable objects for the lab meeting version. If you are building a graphical abstract, check your journal's own size specification first — those are often stated in pixels at a fixed aspect ratio rather than in DPI at all.
When this workflow is not the answer
If your figure is the data — a gel, a blot, a raw micrograph, a flow cytometry plot — nothing in this article applies to the image itself. Export it from the instrument software at native resolution, do not upscale it, do not regenerate it, and do not let any tool reinterpret those pixels. Image-integrity checks at most publishers look specifically for resampling artefacts. Generated images must never stand in for primary experimental data.
If your target journal requires a format FigPad does not export — some still ask for TIFF or EPS specifically — you will finish the job in Illustrator or Inkscape, and that is a normal last step rather than a failure. And some journals ask authors to disclose AI-assisted figure creation, so check your target's policy before you submit.
If your figure is a plot of your own numbers, generate it from your analysis code. Matplotlib, ggplot2 and their relatives write vector PDF and SVG directly, and a plot that regenerates from a script is more reproducible than any drawn copy.
Key Takeaways
- There is no universal DPI. Line art runs 600–1,200 dpi, halftone 300, combination 500–600, and the numbers differ by publisher — Elsevier says 500 for combination art where Cambridge says 600.
- Every spec is measured at final print width. Pixels across = print width in inches × required DPI. Nature single column at 300 dpi is 1,051 px; Elsevier double-column line art at 1,000 dpi is 7,480 px.
- Decide the print width before you draw. Type size and line weights are specified at final size — 7 pt text and 0.25–1 pt strokes at 89 mm, not on an arbitrary canvas.
- If there are no photographic pixels, DPI is the wrong question. Export vector and the resolution requirement stops existing; check embedded fonts and line weights instead.
- Editability is a submission requirement in disguise. Reviewers ask for label changes. A layered file costs you one edit; a flattened one costs you a rebuild.
