
Elsevier does not grade your figure by the software that made it. It classifies the artwork by content, then attaches a number. Bitmap line art needs 1000 dpi — 1200 dpi if the line weights are very fine. Combination art, meaning line work sitting on or beside a photographic element, needs 500 dpi. Grayscale and RGB halftones need 300 dpi. Vector EPS and PDF sidestep dpi entirely, provided every font is embedded and line weights stay between 0.10 pt and 1.5 pt. On top of that sit four target widths — 30, 90, 140 and 190 mm — and a finished lettering size of 7 pt. Journals that have switched on the Artwork Quality Check will tell you whether you hit those numbers. This guide covers what Elsevier states publicly as of October 2026, and which requirement quietly forces a redraw.
One disclosure first. Elsevier's artwork FAQ page renders its answers only in a browser, and the answer text would not load for us on 14 October 2026 — the questions were visible, the responses were not. Everything below comes from Elsevier pages whose content we could actually read today: artwork types, sizing of artwork, the artwork formats checklist, the artwork overview, the graphical abstract page, and Elsevier's support article on AQC. We would rather name the page we could not read than quote a number from a site that scraped it.
Where Elsevier's artwork rules actually live
Most authors meet these rules as a single line in a journal's guide for authors: supply artwork at the correct resolution. The actual specification is spread across at least six pages, and no one page contains all of it.
The artwork types page holds the dpi minimums and the EPS conditions. The sizing of artwork page holds the column widths and lettering sizes, which is also where the pixel arithmetic is defined. The formats checklist holds the accepted file formats, the numbering and caption rules, and the instruction to supply illustrations as separate files. The artwork overview holds the export advice — highest PostScript version for EPS, highest output resolution for TIFF, and a warning that non-standard fonts may be replaced with an Elsevier standard font, which is how symbols go missing and type starts overlapping. The graphical abstract page has its own dimensions and its own font list. And the AQC verdicts live on a different domain altogether, in Elsevier's support knowledge base.
Your target journal's own guide for authors overrides all of it. Check that first; use the pages above to fill the gaps it leaves.
Art type decides the number, not file type
This is the part worth internalising, because it is where most authors guess wrong. You do not pick a resolution for "a figure." You decide which of Elsevier's classes your artwork belongs to, and the class carries the number.
Line art is distinct lines, arrows, type and flat fills, with no tonal gradation: pathway diagrams, schematics, flow charts, chemical structures. As vector EPS it is resolution-independent — Elsevier asks for a preview or document thumbnail, embedded fonts, no data outside the illustration area, and line weights from 0.10 pt to 1.5 pt. Supplied instead as a TIFF bitmap, it must be in bitmap (black and white) mode at a minimum of 1000 dpi, rising to 1200 dpi when the line weights are very fine.
Combination art mixes halftone and line elements — a labelled micrograph, a gel with a plot beside it, a photograph with arrows added. As TIFF or maximum-quality JPEG it needs 500 dpi, with the tonal area in RGB for colour or grayscale for black and white. As hybrid vector EPS, Elsevier specifies 300 (500) dpi for the halftone portion and 1000 dpi for the line art, and notes plainly that embedded bitmap resolution can be difficult to verify. That sentence is a warning: a low-resolution image placed inside an otherwise beautiful EPS can travel a long way before anyone catches it.
Halftones are continuous tone with no vector content: photographs, micrographs, gels, blots. Grayscale (8-bit, 256 levels) and RGB (24-bit) both need a minimum of 300 dpi, as TIFF or JPEG saved at maximum quality, tightly cropped.
Elsevier's accepted format list is broader than its recommended one. TIFF, JPEG, EPS, PDF, Word, Excel and PowerPoint are all accepted; the overview page says outright that Elsevier recommends only EPS, PDF, TIFF or JPEG be used for electronic artwork. Office files are a fallback, not a plan. Colour should be RGB unless the journal's guide says otherwise.
Size it for the column before you export, not after
Resolution is meaningless without a print width, because the pixel count is a product of the two. Elsevier states the arithmetic explicitly: pixels = resolution (dpi) × print size (inches).
That makes the width the first decision, not the last. A double-column line-art figure at 190 mm is 7.48 inches wide, so 1000 dpi means 7,480 pixels across. The same figure at single column, 90 mm, needs 3,543. Export at the wrong width and you are either shipping a file that fails the check or one four times larger than anyone needs.
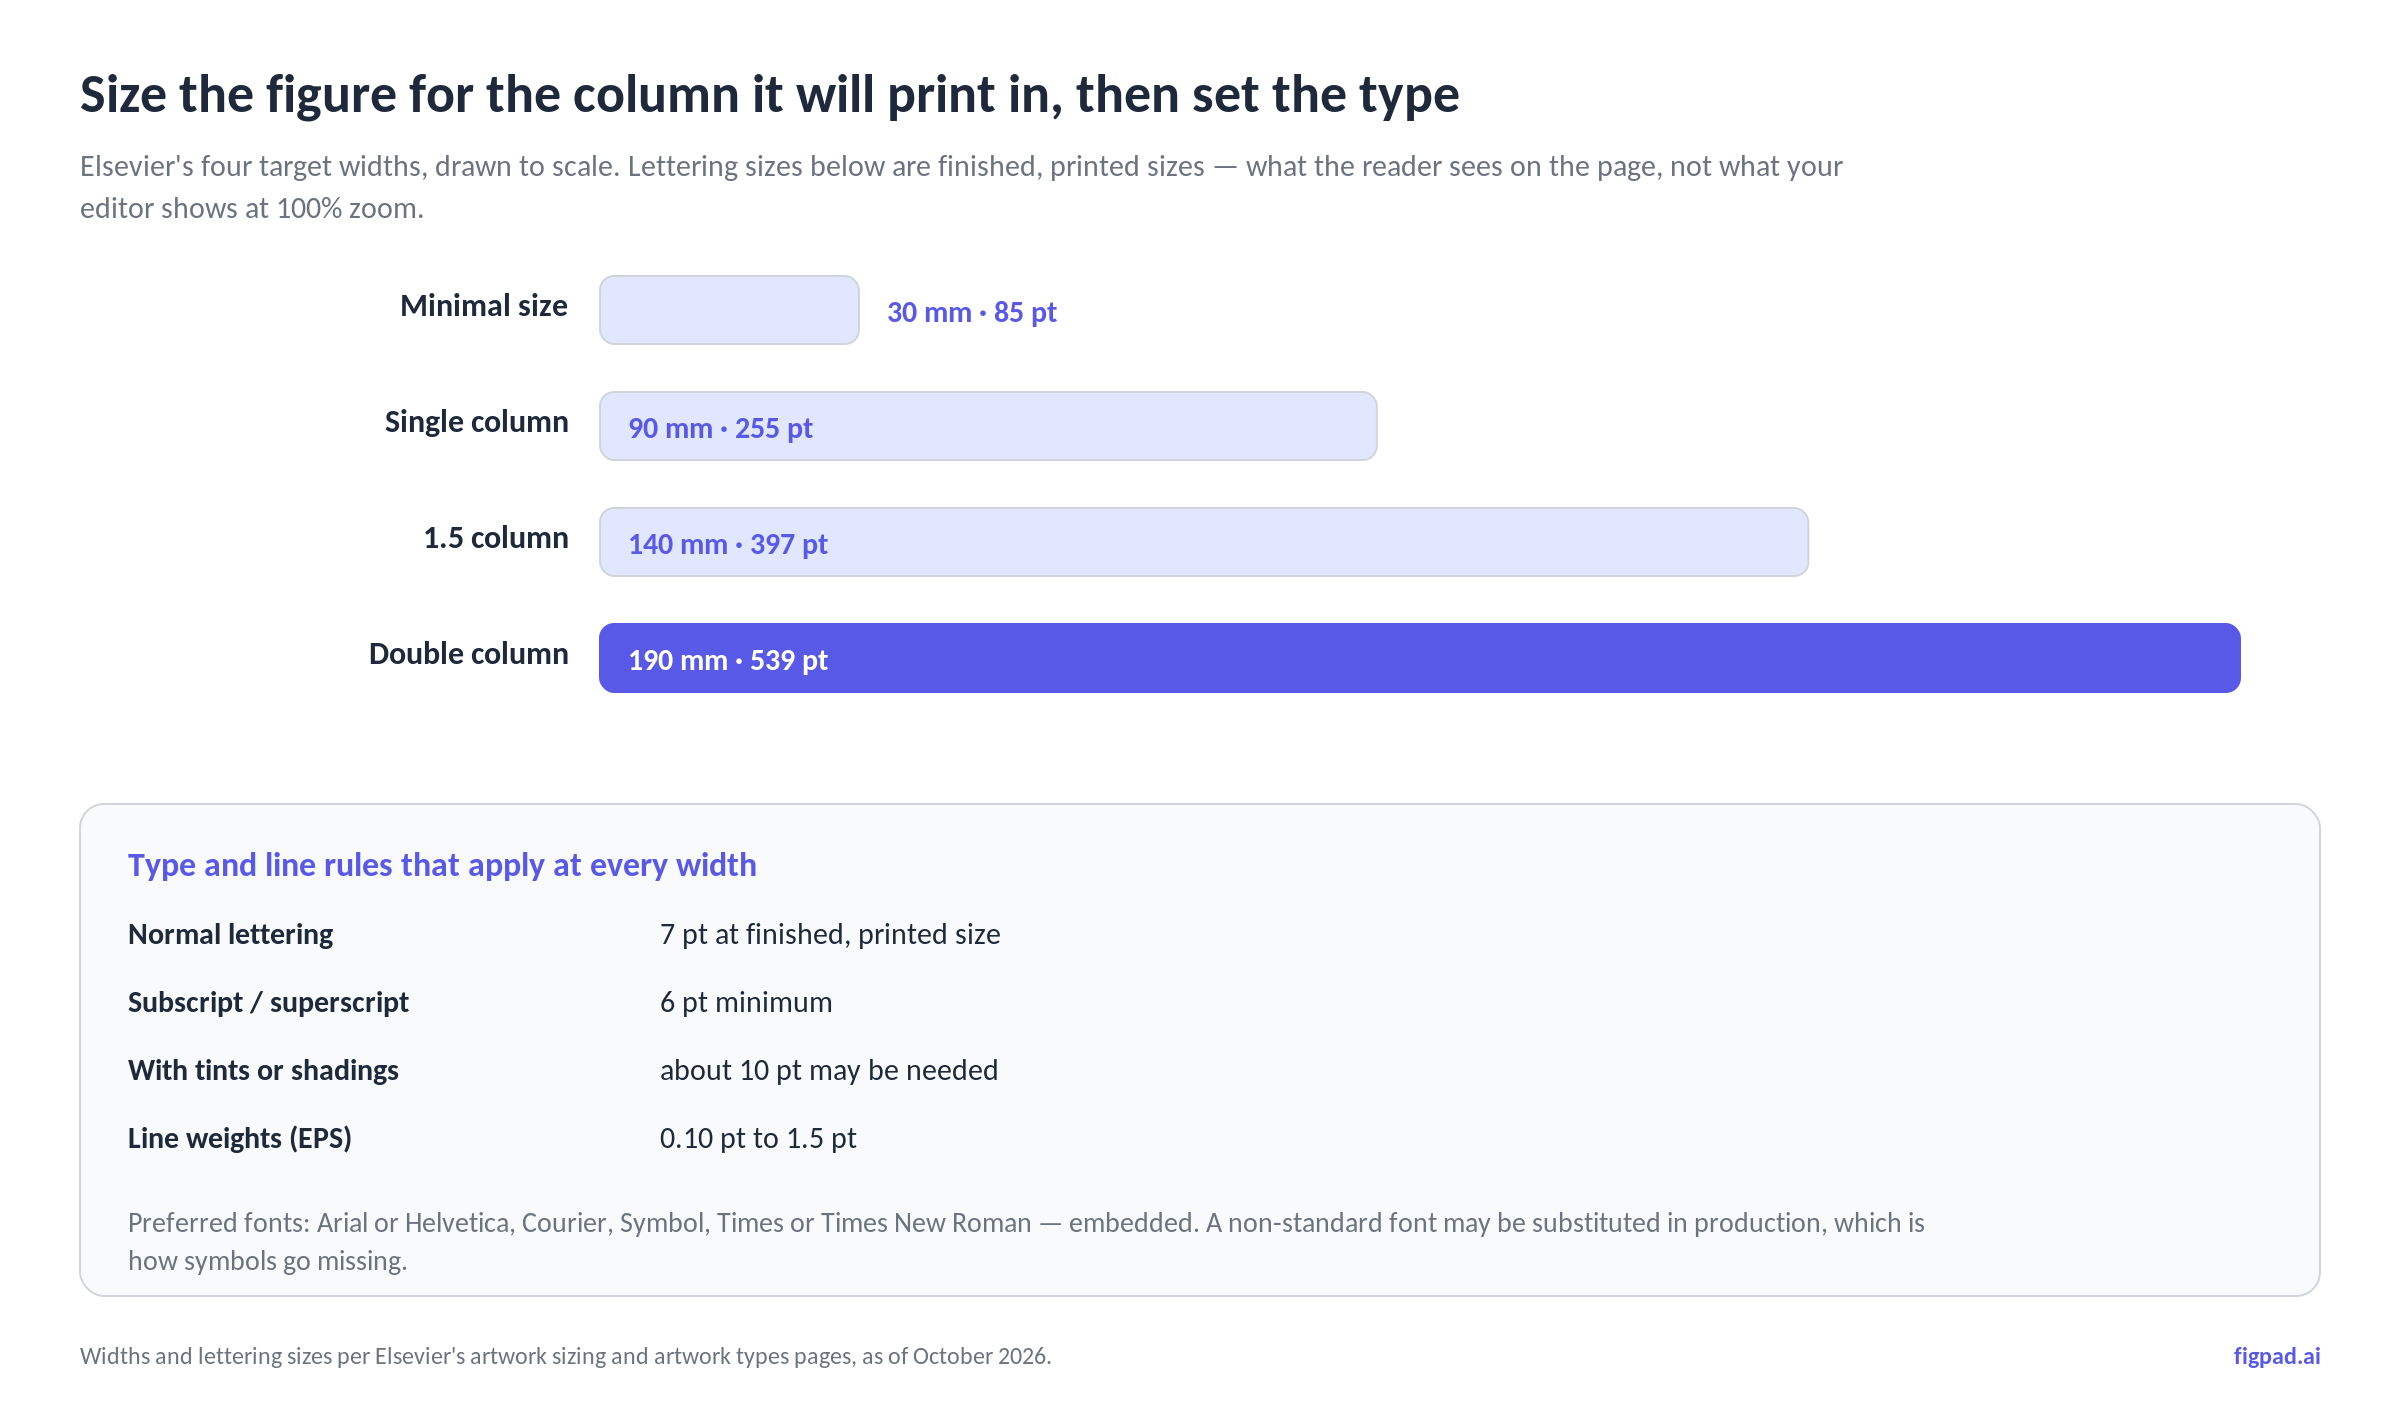
Lettering sizes are given as finished, printed sizes — what the reader sees on the page, not what your editor shows at 100% zoom. Normal text should come out at 7 pt, subscripts and superscripts no smaller than 6 pt, and artwork carrying tints or shadings may need around 10 pt to stay legible. Elsevier's advice on halftones is blunt: do not over-reduce them, and check magnification factors and scale bars against the detail actually present in the image. Similar diagrams across one article should be sized alike, and you may suggest a final size — single, 1.5 or two column — for combination figures where no single reduction suits both halves.
A few mechanical rules travel with the files. Number artwork in the order it appears in the text, refer to every figure in the text, supply illustrations as separate files, and name them so the figure number, type and extension are visible — FIG1.TIF. Captions go in the Figure Caption submission item if the journal has one, otherwise at the end of the manuscript text file. Keep the caption, and any "Fig. 1" label, outside the image area itself.
What the Artwork Quality Check actually does
AQC is a tool inside Editorial Manager, and it only applies if your journal has enabled it. When it is on, your figure files are analysed after you submit or edit a submission, and each file designated for analysis comes back with one of three verdicts: Pass, Pass with Warning, or Fail. You can open a Proflight Detail Report to see the analysis, and for problems it finds, the results describe the issue and suggest possible fixes.
The part authors get wrong: none of the three verdicts stops your manuscript. You can submit with figures that failed. Elsevier's guidance is that new versions should be prepared for any revision — so a Fail at initial submission is a deferred cost, not a blocked one. Replacing a file means clicking Edit Submission, going to the Attach Files step, attaching the new file, removing the old one, and rebuilding the PDF for approval.
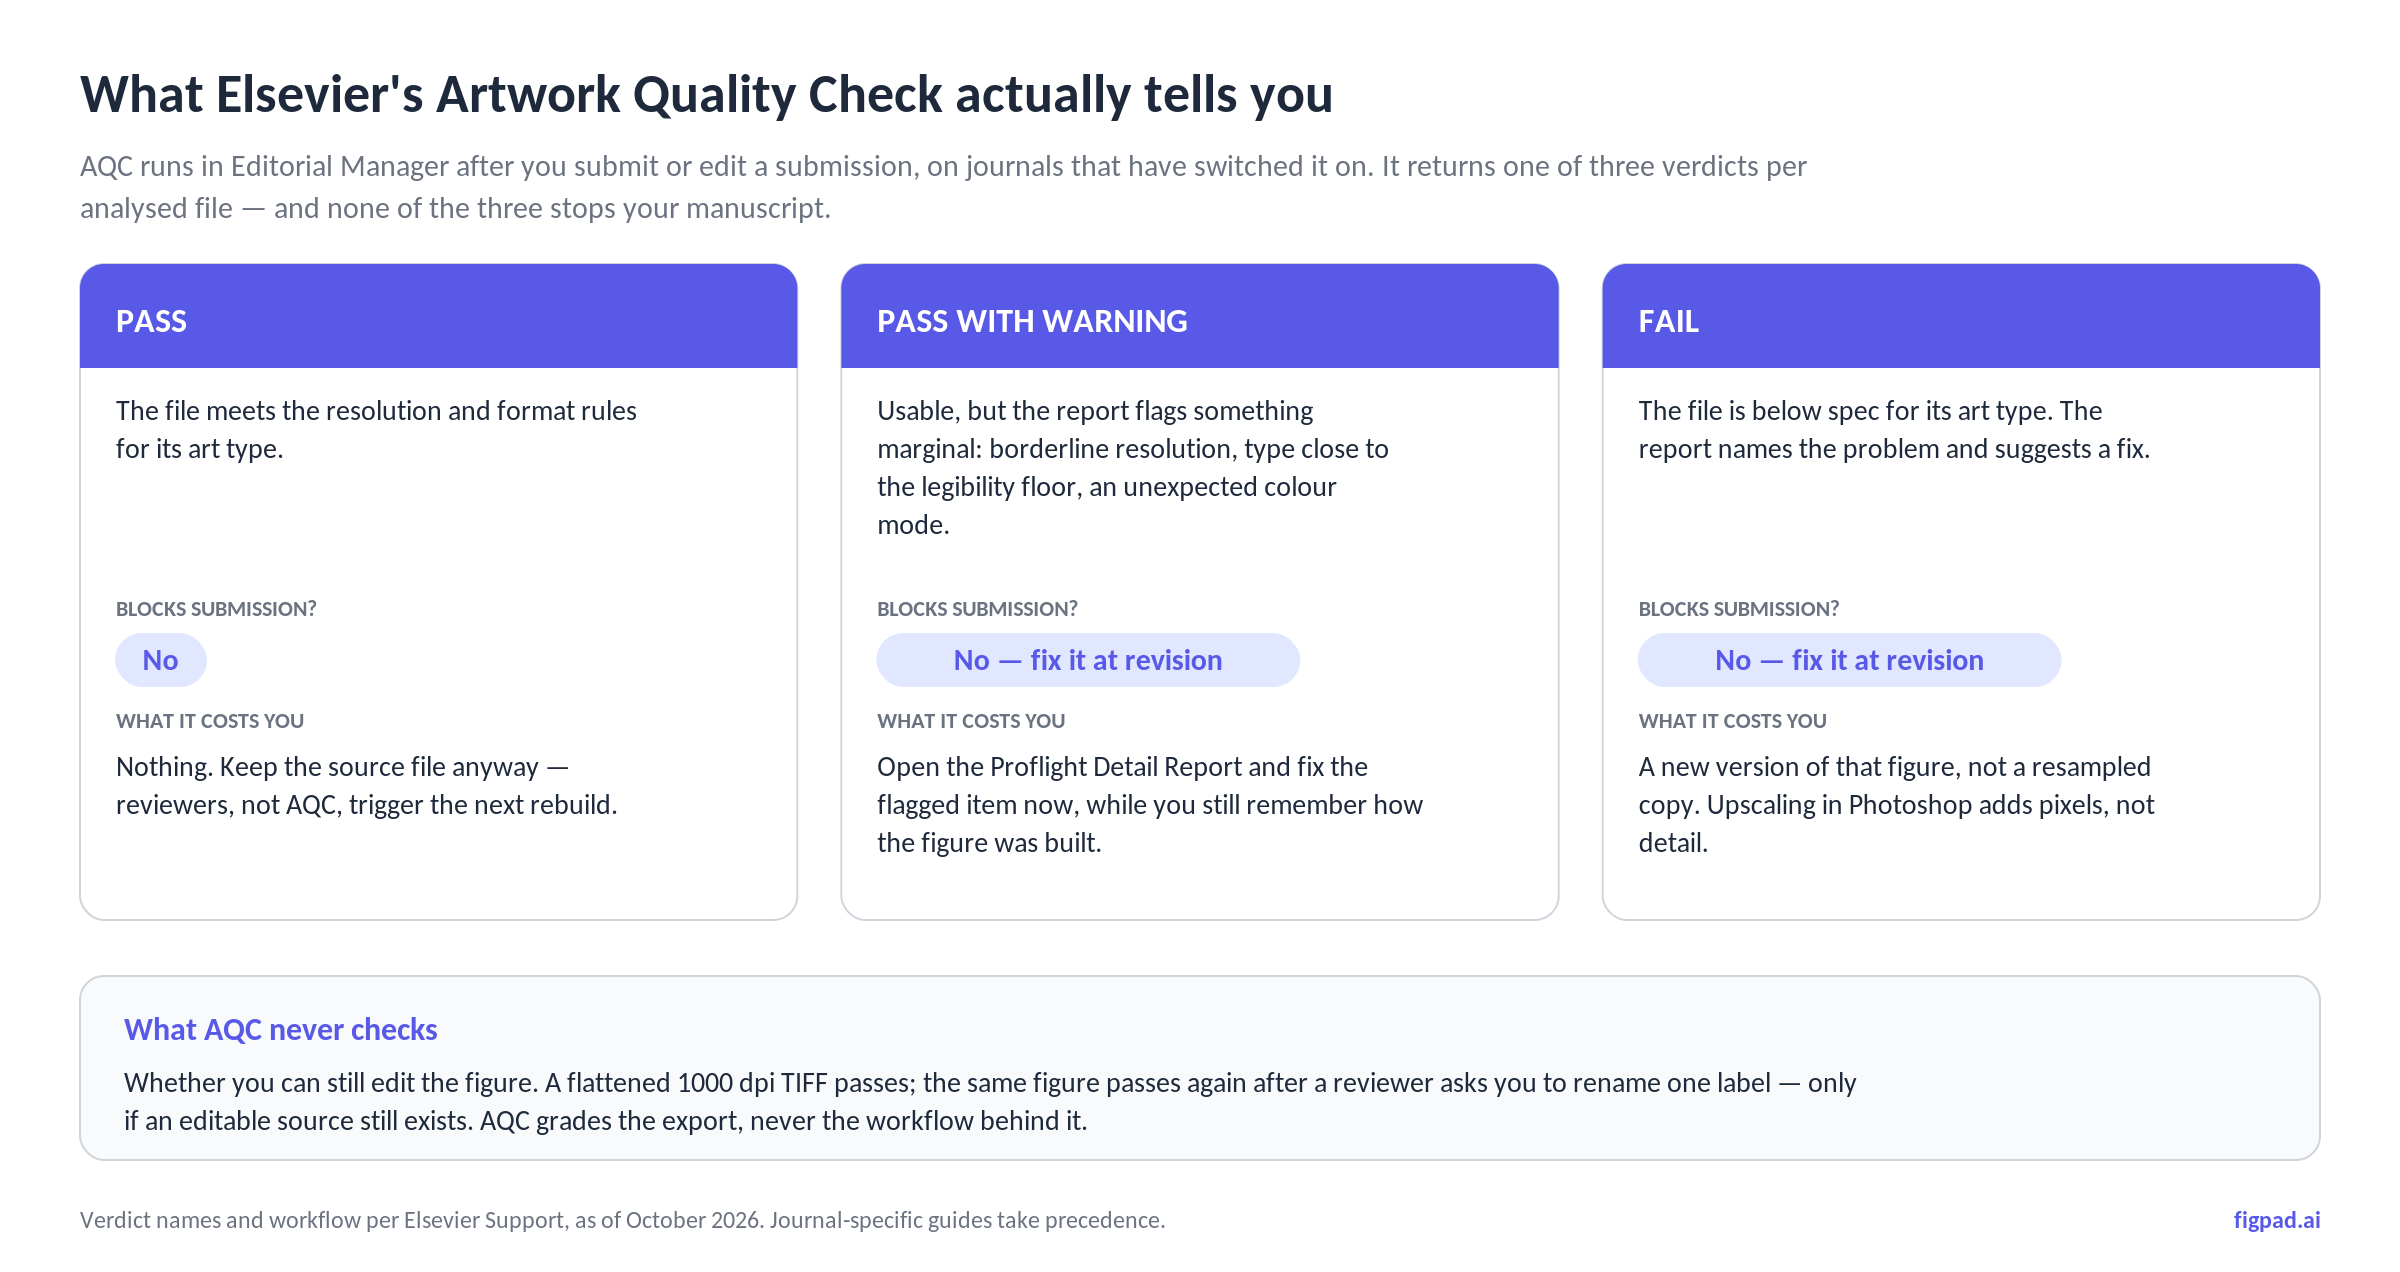
Which leads to the thing AQC cannot see. It checks the export. It cannot tell whether you still have something to re-export from. A flattened 1000 dpi TIFF passes cleanly, and will pass again next week — unless a reviewer asks you to rename one label, at which point the verdict is irrelevant and the only question is whether an editable source still exists.
The graphical abstract has its own spec sheet
Elsevier's graphical abstract requirements are separate from everything above, and stricter in one specific way. The minimum size is 1328 × 531 pixels at a minimum of 300 dpi; larger files should keep the same proportion, because ScienceDirect scales the image into a 500 × 200 pixel rectangle. Accepted formats are TIFF, EPS, PDF or MS Office files. Fonts are Times, Arial, Courier or Symbol, at a size that stays legible once the image is reduced into a 200-pixel-high window in the table of contents.
The content rules matter as much as the dimensions. The image must be original and clearly represent the work; it should read top-to-bottom or left-to-right with a clear start and end; no additional text, outline or synopsis sits outside it, so every label must live inside the image file; and no "Graphical Abstract" heading inside the image itself. Upload it as a separate file. Elsevier also states that any use of generative AI must follow its generative AI policies for journals — check your target journal's disclosure expectations rather than assuming silence is acceptable.
The 2026 Elsevier artwork decision table
| Your figure contains | Elsevier class | Minimum | Best format | Pixels at 190 mm |
|---|---|---|---|---|
| Lines, arrows, type, flat fills | Line art | 1000 dpi (1200 dpi for very fine lines) | Vector EPS or PDF, fonts embedded | 7,480 if supplied as bitmap |
| Line work on or beside a photo | Combination | 500 dpi | TIFF, or hybrid EPS | 3,740 |
| Photo, micrograph, gel, blot | Halftone (grayscale or RGB) | 300 dpi | TIFF, or JPEG at max quality | 2,244 |
| Any of the above as vector | EPS / PDF | No dpi — resolution-independent | EPS, highest PostScript version | n/a |
Widths and dpi as of October 2026, from Elsevier's artwork types and sizing pages. Pixel counts are 190 mm (7.48 in) × the stated dpi. Prices and specifications may change; we re-check monthly, and your journal's guide for authors takes precedence.
How FigPad fits
FigPad's position on this is narrow and worth stating plainly: it does not hand you a TIFF that passes AQC by itself. What it does is keep the figure editable long enough that hitting these numbers stops being a redraw.
The workflow is prompt, sketch or reference image into a figure, then editing on canvas — moving a label, fixing a term, swapping an arrow — before exporting. Layered SVG means the text is still text and the arrows are still arrows, not a stroked outline welded into one shape, which is exactly the property that decides whether a reviewer's "please relabel panel C" costs you ten minutes or an evening. The AI scientific figure generator and the scientific figure creator pages show what that loop looks like on a real figure; for Elsevier's separate graphical abstract spec, the graphical abstract generator page is the relevant one.
On cost, the numbers are public rather than per-figure: one generation is 2 credits, a text correction is 2, editing elements directly on the canvas is free, and exporting an editable SVG is 4 credits, with repeat exports of the same version free. A generation, five text corrections and one SVG export is 16 credits. Plans start at $12/month billed yearly; Plus is $20/month billed yearly or $29 month-to-month, Pro is $29/month billed yearly or $49 month-to-month, and one-time credit packs start at $12 for 95 credits that never expire (prices checked 2026-11-02). See pricing for current figures. Figures on free and paid plans come with publication rights — Elsevier will not ask you for a separate licence — and FigPad's terms state it does not use your content to train its models, which matters when the input is an unpublished manuscript figure.
When FigPad is the wrong tool for this
Three honest limits.
First, format. FigPad exports layered SVG (on every plan, including free), editable PPTX, and PNG or JPG at the resolution the model generates. Elsevier recommends EPS, PDF, TIFF or JPEG. SVG is not on that list, so there is a conversion step: open the SVG in Inkscape, Illustrator or any vector editor and save as PDF or EPS with fonts embedded. It is one step, it is lossless, and we would rather you plan for it than discover it at upload.
Second, photographic content. If your figure is a micrograph, a gel or a blot, the 300 dpi minimum applies to pixels your microscope recorded. No generator adds detail a sensor never captured. Generated imagery belongs in schematics and diagrams, never presented as primary experimental data.
Third, standardised icon libraries. If your field expects a specific, widely recognised visual vocabulary and your lab already has a tool that provides it, that familiarity is real value. Switch for the editing workflow, not because someone told you the output looks better.
Key Takeaways
- The class sets the number. Line art 1000 dpi (1200 for fine lines), combination 500 dpi, halftone 300 dpi — decided by what is inside the panel, not by your software.
- Vector removes the dpi question entirely, but only with fonts embedded, line weights between 0.10 and 1.5 pt, and no data outside the illustration area.
- Width comes first. Pixels = dpi × inches, against Elsevier's 30 / 90 / 140 / 190 mm targets. Finished lettering is 7 pt, 6 pt minimum for sub- and superscripts.
- No AQC verdict blocks submission. A Fail is a deferred cost: Elsevier expects corrected files at revision, which means you need the source months after you built it.
- The graphical abstract is a separate spec — 1328 × 531 px minimum at 300 dpi, scaled into a 500 × 200 window, all text inside the image, uploaded as its own file.
