
Hi everyone, I'm Teacher Tu.
The most annoying part of making scientific figures is often not that you cannot draw, but that you do not know where to find assets. When drawing cells, animal experiments, signaling pathways, and experimental workflow diagrams, you always have to search everywhere for icons, adjust colors, and change lines. In the end, it often becomes "two hours drawing the figure, five hours finding assets."
Today, I have organized several scientific illustration asset websites that I think are commonly used, and I will also briefly explain what scenarios each of them is suitable for.
One reminder first: although asset websites are convenient, before formal submission, commercial use, or public release, you must confirm licensing, attribution, and export-format requirements. Whether a scientific figure looks good is one thing; copyright and journal requirements cannot be ignored either.
01 | SciDraw: suitable for finding basic scientific SVG elements
Website link: https://scidraw.io/
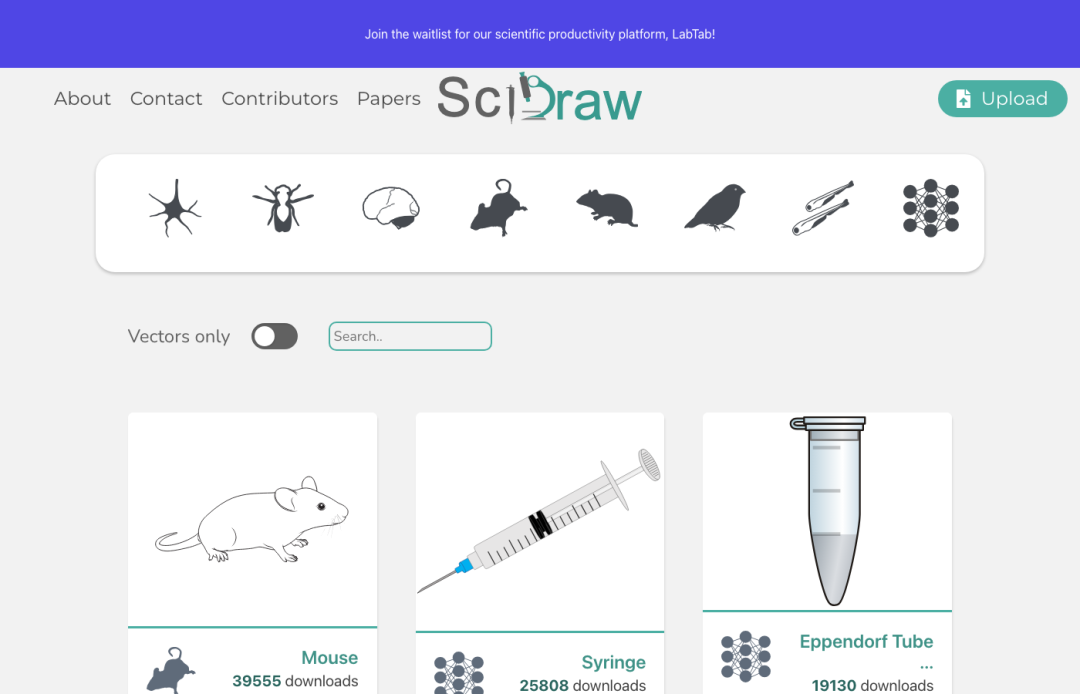
SciDraw is an asset library with a scientific-research focus. It contains many common biomedical elements, such as cells, mice, rats, fish, birds, human organs, syringes, Petri dishes, centrifuge tubes, DNA, and so on. It is more suitable for animal experiment workflow diagrams, cell experiment schematics, simple mechanism figures, and Graphical Abstracts.
I think SciDraw's biggest advantage is that many assets provide SVG vector formats. SVG does not easily become blurry when enlarged, and it is also convenient to put into Illustrator, PowerPoint, or other vector editing tools for further adjustment. If you are only missing a few "basic building blocks in scientific figures," you can start here.
Before using it, I suggest opening the specific asset and checking the author, citation, and licensing information. The usage requirements of different assets may vary, especially for paper submission or commercial scenarios. Do not assume that "if it can be downloaded, it can be used however you want."
02 | Bioicons: a clean-style biological science icon library
Website link: https://bioicons.com/
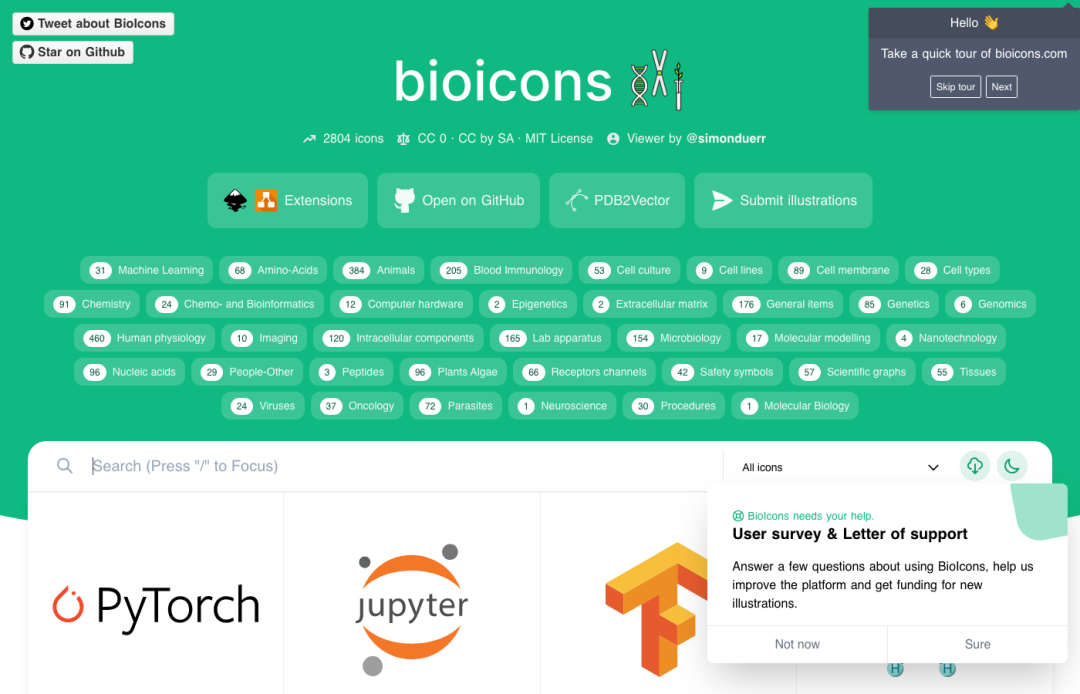
Bioicons is a free and open-source biological science icon library. The overall style is relatively simple, suitable for clean, unified, and not overly flashy scientific figures. You can find cell types, microorganisms, DNA, RNA, proteins, experimental equipment, and molecular biology-related elements inside it.
Personally, I think it is especially suitable for workflow diagrams and concept diagrams. For example, single-cell sequencing workflows, sample processing workflows, and experimental design diagrams do not necessarily need complex 3D illustrations. What they need more is unified icons, clear lines, and clean information. Bioicons is very handy in this kind of scenario.
However, "open source" does not mean there are absolutely no requirements. Different icons may correspond to different licenses, so it is best to confirm whether attribution is required before downloading.
03 | BioRender: a mature scientific figure template tool
Website link: https://www.biorender.com/templates

BioRender should be a tool many research students already know. Its advantages are a mature illustration style, rich templates, and expressions that are very close to life-science papers. For cell biology, immunology, neuroscience, oncology, drug mechanisms, experimental workflows, and clinical research illustrations, you can find quite a few templates.
If you want to quickly make a more "journal-style" mechanism figure, review figure, grant proposal figure, or teaching schematic, BioRender's template system really saves time. It is especially suitable for biomedical illustrations that need a unified visual style.
What needs attention is that BioRender's export permissions, publication use, and licensing scope are usually related to the account version. Before formal submission, make sure to read the licensing instructions clearly, especially for paper publication and commercial use scenarios.
04 | Flaticon: very convenient for adding general icons
Website link: https://www.flaticon.com/search
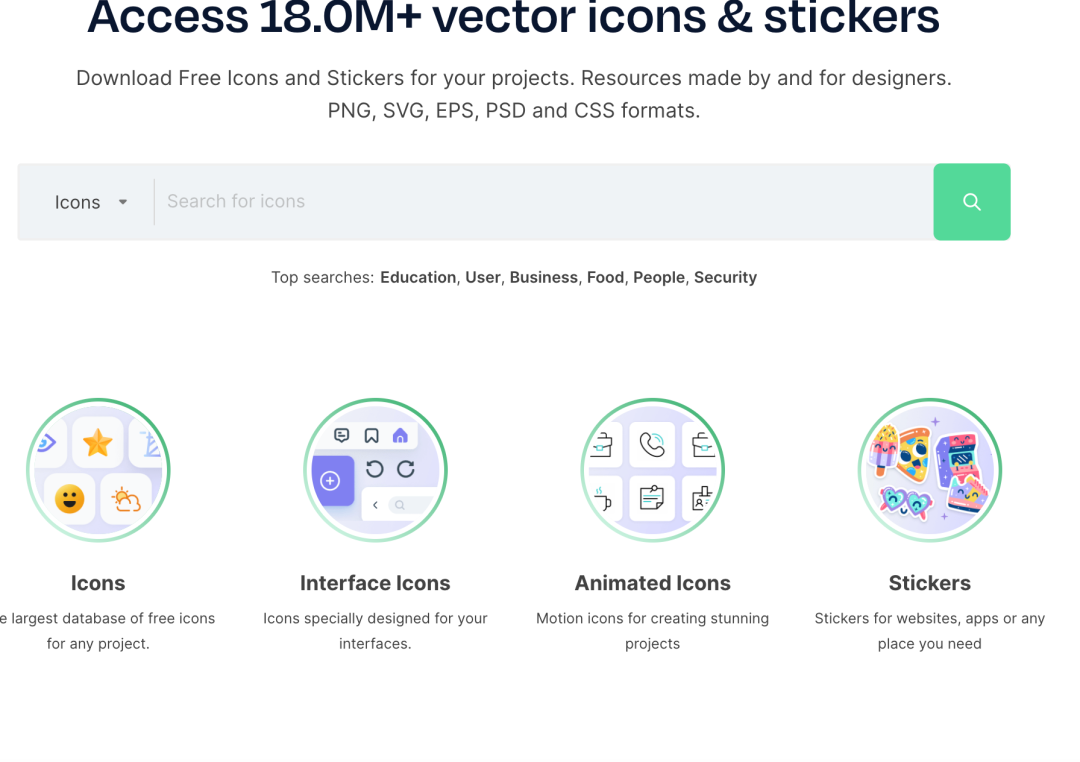
Flaticon is suitable for finding general icons that are often needed in scientific figures but are not necessarily scientific-specific, such as computers, cloud, databases, AI, hospitals, users, files, algorithms, statistical charts, and so on. These elements are common in bioinformatics workflow diagrams, AI medicine schematics, and database platform introduction figures.
For example, if you want to draw an AI-assisted diagnosis workflow: patient data, medical imaging, AI model, risk prediction, and clinical decision-making. Besides medical elements, you will also use general icons such as data, servers, models, and reports. Flaticon is very suitable as a supplement here.
Again, a reminder: Flaticon's assets also require checking licensing and attribution requirements, especially for public release and commercial use.
05 | IAN Symbol Libraries: suitable for ecology and environment directions
Website link: https://ian.umces.edu/media-library/symbols/
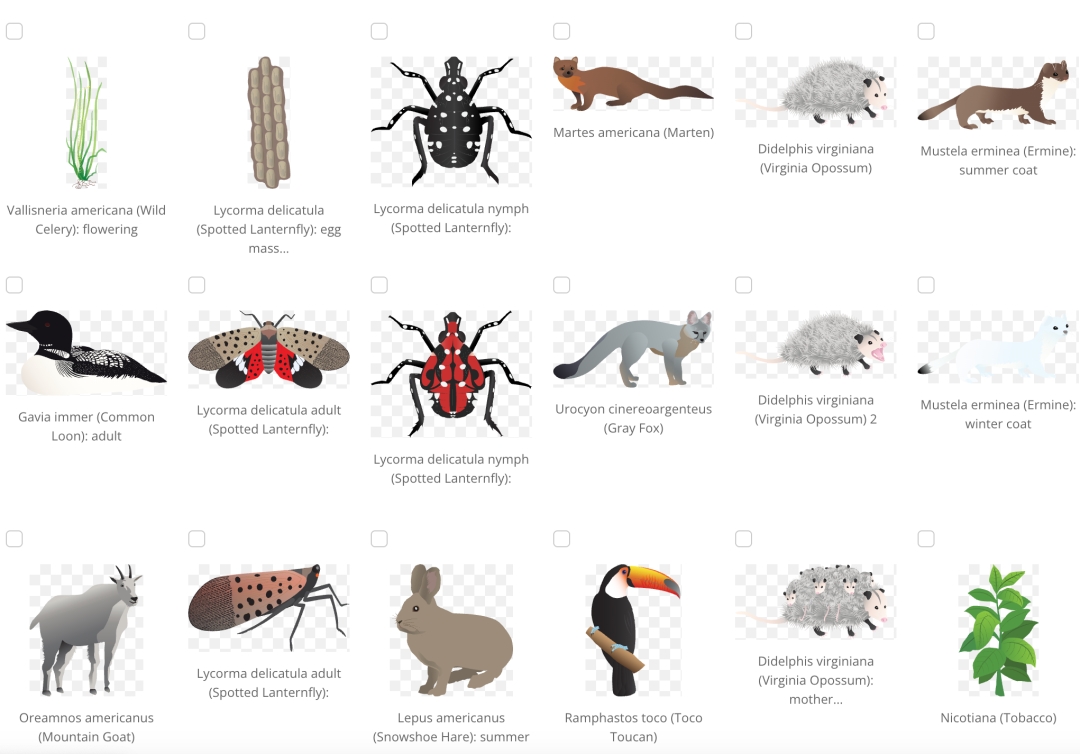
This website is more suitable for ecology, environmental science, ocean science, agriculture, geography, conservation biology, and climate-change-related figures. It contains many vector symbols related to environment and ecology, such as rivers, wetlands, fish, birds, forests, agriculture, human activities, pollution sources, and management measures.
If you want to draw ecosystem concept diagrams, watershed management diagrams, pollution transport diagrams, carbon cycle or nitrogen cycle schematics, IAN Symbol Libraries will be more suitable than ordinary biological icon libraries.
06 | NASA Scientific Visualization Studio: suitable for climate, remote sensing, and space science
Website link: https://svs.gsfc.nasa.gov/
If your direction involves climate, remote sensing, astronomy, or space science, you can look at NASA Scientific Visualization Studio. It is not an ordinary asset library, but a visualization resource library made by NASA based on real scientific data. It contains a large number of images and animations related to Earth systems, sea ice, ocean circulation, atmosphere, solar activity, Earth observation, and space science.
It is more suitable for science communication, presentations, course displays, and visualization inspiration.
07 | RAWGraphs: suitable for data relationship diagrams
Website link: https://www.rawgraphs.io/
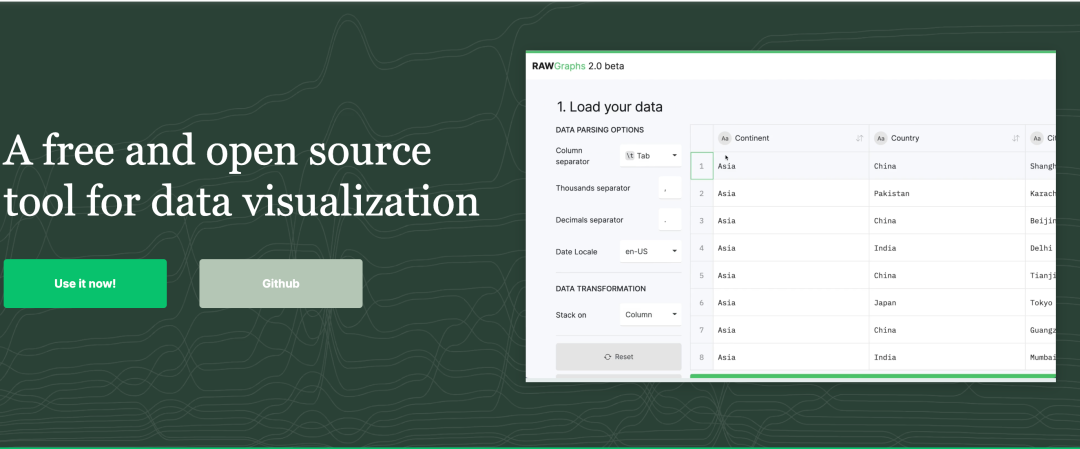
If your figure is not a mechanism figure but a data relationship diagram, you can try RAWGraphs. It is a free and open-source data visualization tool, suitable for quickly converting Excel or CSV data into more expressive graphics such as Sankey diagrams, chord diagrams, tree maps, and bubble charts.
Social science, management, communication studies, public health, economics, and interdisciplinary fields may all find it useful.
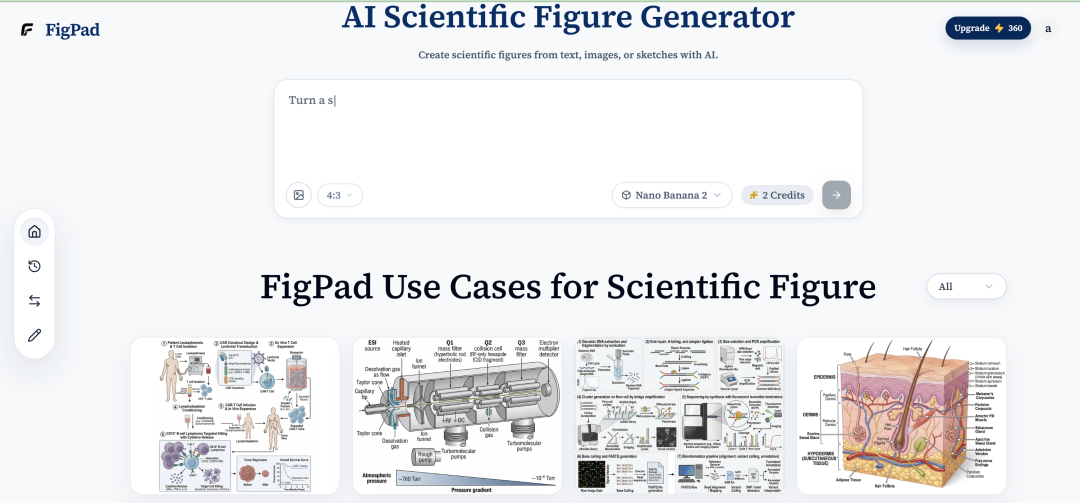
08 | FigPad: generate scientific illustrations from text, sketches, or reference images
Website link: https://figpad.ai/
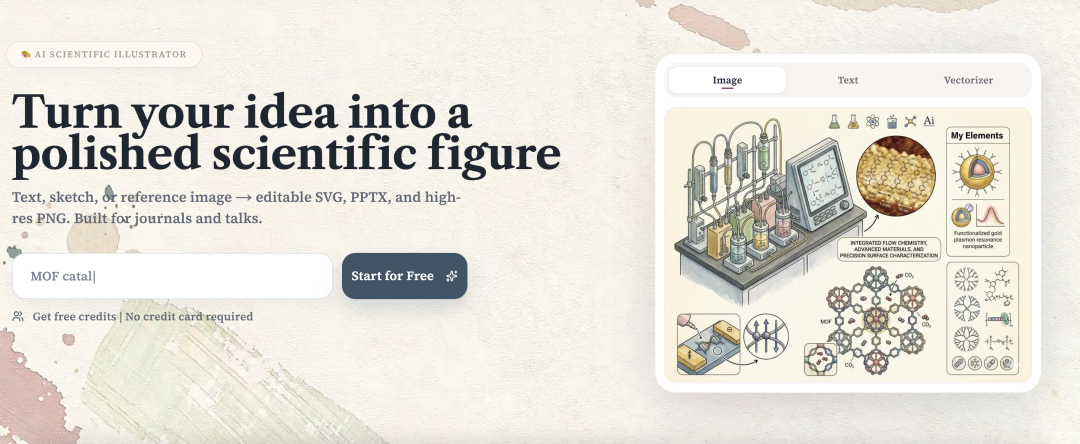
FigPad is different from the previous asset websites. It does not ask you to download a few icons and slowly assemble them. Instead, it directly faces scientific-figure scenarios and helps you generate a complete first draft of a scientific illustration.
If you already know what the figure needs to express but do not want to start from a blank canvas, you can use By Text and directly enter a text description, such as a signaling pathway, drug action mechanism, cell interaction, material structure, or experimental workflow. It is more suitable for the situation where "the logic is already in your mind, but you do not want to build layers from scratch."
If you are used to drawing a draft on paper first, you can also use By Sketch. Upload a hand-drawn sketch and add a short explanation; FigPad can generate a more complete and cleaner scientific figure according to your composition intention. This feature is suitable for students who "already have the idea, but whose drawing skills cannot keep up."
There is also a scenario of style consistency. For example, if you need to make a set of mechanism figures, workflow diagrams, and model diagrams, and you want the overall colors, lines, and layout to stay consistent, you can use By Image to refer to the visual style of existing images and then generate similar expressions.
The most practical thing about FigPad.ai: you can still edit after generation
I think the reason FigPad is truly suitable for researchers is not that "AI can draw figures," but that after generation, you can continue editing. Scientific figures will definitely be revised. If every tiny change requires regenerating, the efficiency is actually not high.
FigPad supports exporting editable SVG vector files and also high-definition PNG. In other words, you can first use AI to quickly generate a draft, then put the SVG into Illustrator and other tools for further refinement: changing text, switching colors, moving elements, adjusting arrows, unifying line widths, and finally re-layout according to journal requirements.
Usage suggestions
If you are only missing a few icons of cells, animals, or experimental equipment, you can first look at SciDraw and Bioicons; if you want mature life-science templates, look at BioRender; if you want to supplement general icons and design elements, look at Flaticon; if your direction leans toward ecology, environment, remote sensing, space science, or data visualization, look at IAN Symbol Libraries, NASA Scientific Visualization Studio, and RAWGraphs; if you want to directly generate scientific illustrations from one sentence, a sketch, or a reference image and then continue secondary editing, you can try FigPad.
Different tools do not replace one another; they are suitable for different stages. In the early stage, asset websites are useful for finding inspiration; in the middle stage, AI tools save more time for quick figure generation; in the later stage, vector editing ability is critical for polishing and submission.
Scientific figure drawing is not about piling assets together. For a good scientific figure, the most important thing is still scientific logic: who acts on whom, where the process starts, where the result points, and whether readers can understand at a glance what the figure wants to express.
I hope these websites and tools today can help you spend less time picking assets and leave more time to think clearly about the scientific question inside the figure.
Previous recommendations
Nature sub-journal | How to write a good literature review?
Scientific Figure Drawing: How to Directly Generate Editable PPT
Scientific Figure Drawing: Generate Editable Vector Graphics with AI in One Click
Use Citely to check draft references and automatically recommend references
