
Hi everyone, I'm Teacher Tu.
When many people use AI to make scientific figures, their first reaction is to copy in the paper abstract, research background, and experimental results all at once.
The result is often: the figure looks flashy, but the information is unclear; there are many elements, but the logic is messy; it looks like a promotional poster, but not like a paper figure.
The biggest difference between scientific figure drawing and ordinary AI drawing is:
It does not simply pursue "good-looking"; it needs to express scientific structure, mechanism pathways, and visual hierarchy clearly.
A truly useful scientific figure prompt usually needs to solve several questions:
What type of figure is this? Is it a mechanism figure, workflow diagram, system architecture diagram, material cross-section diagram, instrument structure diagram, or journal cover figure?
What is the core object? Is it a battery structure, urban heat island, carbon cycle, AI model, instrument module, or experimental workflow?
How should the relationship be expressed? Is it transport, layering, cycling, input-output, causal chain, or module connection?
How should the picture be organized? Is it left-to-right, layered top-to-bottom, central radial, cross-sectional structure, or system network?
What visual-style constraints are there? Background, color scheme, arrows, label density, and whether to avoid a poster-like feel all need to be stated in advance.
So, rather than stuffing a long paragraph of research background into the model, it is better to write the prompt using the "structure of the figure."
Below, I have organized several prompt templates that are very common in scientific figure drawing and also relatively easy to reuse. You can directly replace the research object, structural modules, and mechanism processes.
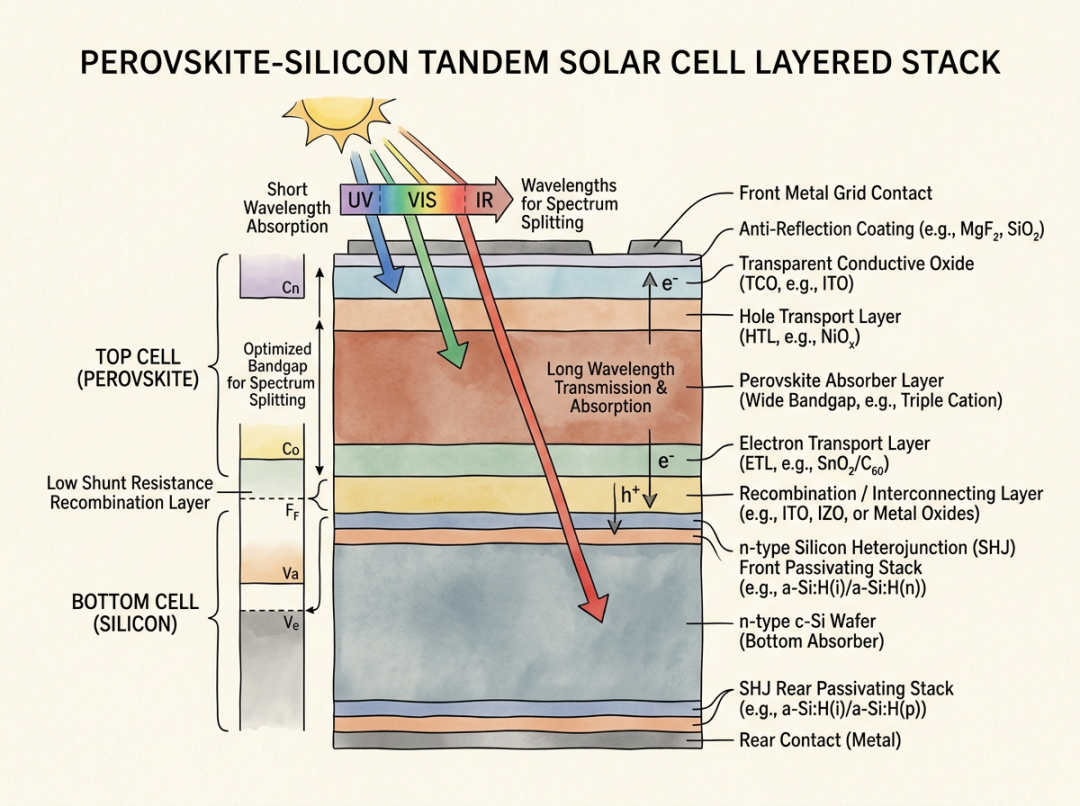
01 | Materials structure figure: perovskite-silicon tandem solar cell
This type of figure is suitable for showing multilayer device structures, such as solar cells, flexible sensors, membrane materials, semiconductor devices, multilayer coatings, and so on.
Its focus is not to draw a beautiful device, but to clearly explain the position, function, and interface relationship of each layer.
Result display
Not recommended to write like this
Draw a scientific figure of a perovskite solar cell, make it look advanced.
This sentence is too empty. The model does not know whether you want to draw the appearance, structure, working principle, or performance comparison.
Recommended prompt
Please generate a material structure schematic suitable for paper publication. The topic is a perovskite-silicon tandem solar cell. The figure should show a top-to-bottom multilayer stacked structure, including the transparent electrode, electron transport layer, perovskite absorber layer, hole transport layer, silicon bottom cell, and back electrode. Please use a cross-sectional structure layout, clearly show the interface relationships between different functional layers, and use concise labels to mark each layer. The overall style should be professional, clear, and suitable for a materials science paper figure. Please use a light background, and use low-saturation blue, purple, and gray to distinguish different material layers. Avoid exaggerated 3D rendering, and do not make it into a commercial promotional poster.
English Prompt
Create a publication-ready scientific figure about a perovskite-silicon tandem solar cell layered stack. Show the transparent electrode, electron transport layer, perovskite absorber, hole transport layer, silicon bottom cell, and back electrode in a clean cross-section layout.Use clear labels to identify each functional layer and make the interface relationships easy to understand. Use a clean scientific illustration style with a light background, muted blue, purple, and gray tones. Avoid overly glossy 3D rendering, advertising style, and decorative background.
Small summary of the prompt pattern
The core of a materials structure figure is hierarchy. Do not only write "draw a solar cell." You need to write clearly: which layers there are, how they are arranged from top to bottom, and what function each layer has.
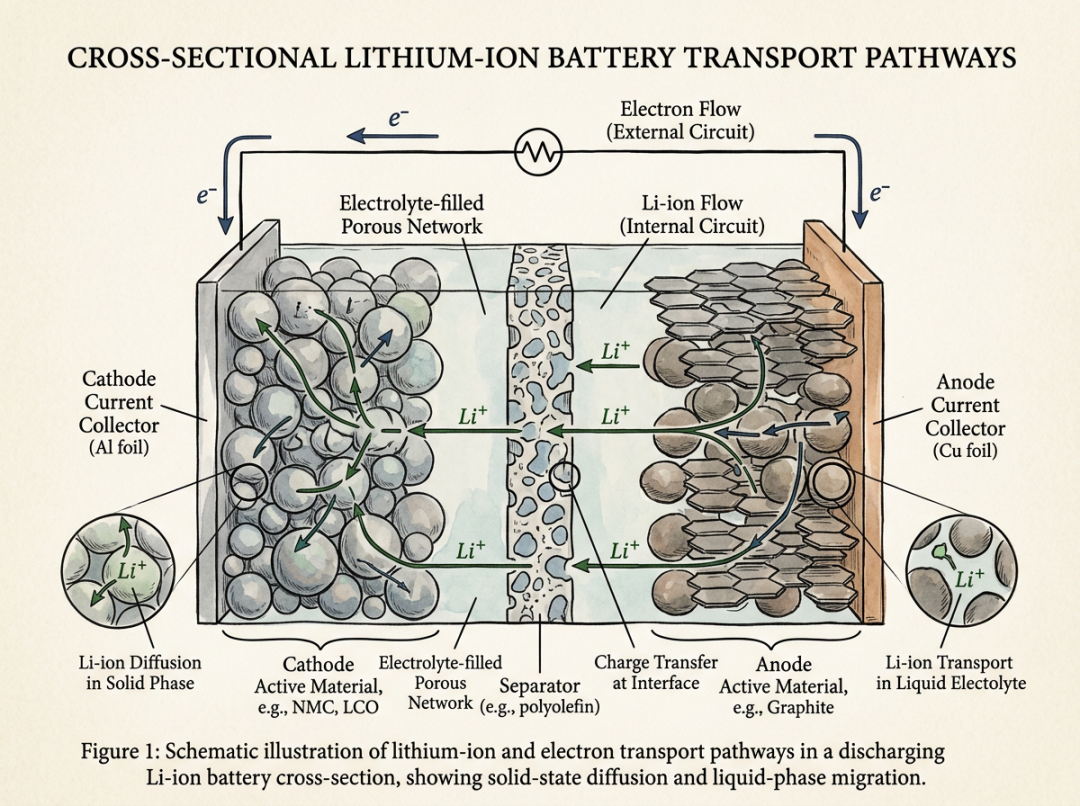
02 | Transport mechanism figure: lithium-ion battery cross-section and ion migration
Energy, materials, and electrochemistry fields often need to draw "structure + transport pathway."
For example, lithium-ion migration, electron conduction, pore diffusion, interfacial reaction, and heat transport. For this type of figure, you must draw out "how things flow."
Draw a lithium battery structure diagram.
With this, the model is very likely to only draw the appearance of a battery, or a very general popular-science figure.
Please generate a lithium-ion battery cross-sectional transport mechanism diagram for a paper. The figure should show the cathode, separator, electrolyte, anode, and current collector structures, and focus on showing the lithium-ion migration pathway during charge and discharge, the direction of electron flow in the external circuit, and the reaction area at the electrode-electrolyte interface. Please use a horizontal cross-sectional layout, use arrows to represent lithium-ion migration and electron conduction directions, and add a local zoom-in view at the electrode interface to show ion intercalation/deintercalation. The overall style should be clean, professional, and suitable for an energy materials paper. Please use a white or light background, use blue and gray to represent the battery structure, and use orange or green to highlight ion transport pathways. Avoid complex backgrounds and excessive text explanation.
Create a publication-ready cross-sectional mechanism diagram of lithium-ion battery transport pathways. Show the cathode, separator, electrolyte, anode, and current collectors. Emphasize lithium-ion migration during charge and discharge, electron flow through the external circuit, and interfacial reactions at the electrode-electrolyte boundary.Use a horizontal cross-section layout with arrows for ion migration and electron transport. Add a zoom-in view of ion intercalation and deintercalation at the electrode interface. Use a clean scientific style with a light background and restrained colors.
Transport mechanism figures cannot only write "structure." You must write clearly: what the transported object is, where it moves from and to, which interfaces it passes through, and what functional result it finally leads to.
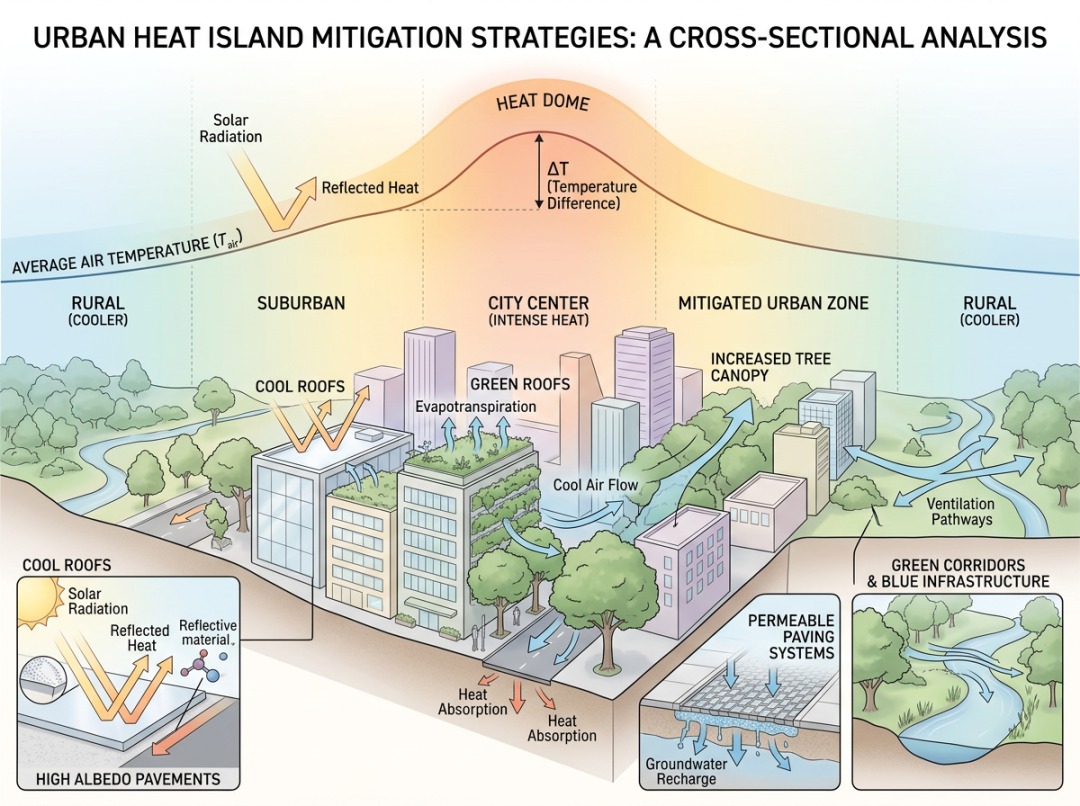
03 | Environmental mechanism figure: urban heat island and mitigation measures
Figures in environmental science, urban planning, and ecological engineering are very suitable to draw in the form of "problem mechanism + intervention measures."
The focus of this type of figure is not to draw a city, but to explain clearly the relationships among heat sources, temperature gradients, greening, water bodies, albedo, ventilation corridors, and other factors.
Draw a figure of the urban heat island effect.
This sentence easily generates a city landscape image instead of a scientific mechanism figure.
Please generate a scientific schematic of the urban heat island effect and mitigation measures. The figure should show the contrast between dense buildings in the urban center, hardened road surfaces, heat accumulation, increased temperature, and lower temperatures in suburban or green areas. Please use a horizontal urban cross-section layout, with the left side showing high-density buildings and heat accumulation, and the right side showing mitigation measures such as green roofs, urban green spaces, water bodies, light-colored pavement, and ventilation corridors. Please use arrows to indicate heat flow, airflow, and cooling pathways. The overall style should be clear and professional, suitable for an environmental science paper or policy report. Please use a light background, use orange-red to represent high-temperature areas, and blue-green to represent cooling and ecological interventions. Avoid cartoon city illustration style, and do not pile up too many decorative elements.
Create a publication-ready scientific figure about urban heat island mechanisms and mitigation interventions. Show dense buildings, impervious surfaces, heat accumulation, elevated urban temperature, and cooler suburban or green areas.Use a horizontal urban cross-section layout. Show mitigation strategies such as green roofs, urban vegetation, water bodies, high-albedo pavement, and ventilation corridors. Use arrows to indicate heat flow, airflow, and cooling pathways. Use orange-red for heat accumulation and blue-green for cooling interventions.
Environmental mechanism figures are best written as: problem source + transport pathway + intervention measures + result change. If you only write an environmental phenomenon, it is hard for the model to know whether you want to express a mechanism or a scene.
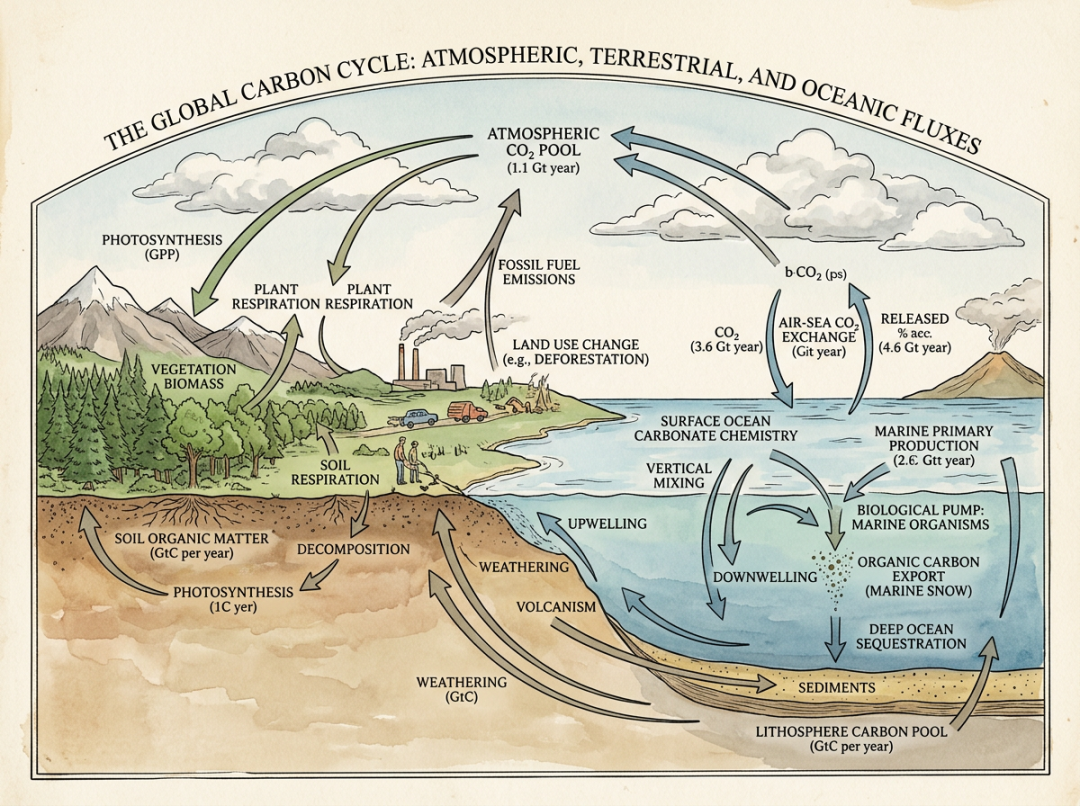
04 | System cycle diagram: global carbon cycle
If your research object is a large system, such as the carbon cycle, nitrogen cycle, water cycle, microplastic migration, or ecosystem energy flow, do not write it as a one-way flowchart.
It is more suitable to write it as a "system cycle diagram" or "flux diagram."
Draw a global carbon cycle diagram.
This sentence is too broad. It easily generates a popular-science illustration and lacks the flux relationships needed in a scientific figure.
Please generate a scientific schematic of the global carbon cycle. The figure should show carbon storage and carbon flux relationships among the atmosphere, terrestrial vegetation, soil, ocean, and human activities, including photosynthesis, respiration, air-sea exchange, fossil fuel combustion, land-use change, and carbon sink processes. Please use a system cycle diagram layout, and use arrows in different directions to show the exchange pathways of carbon among the atmosphere, ocean, and land. You can use arrow thickness or color to distinguish major and minor fluxes, while keeping the figure structure clear. The overall style should be suitable for environmental science or Earth system science papers. Please use a natural-science atlas style, with a simple background, blue for the ocean, green for terrestrial ecosystems, and gray or orange for anthropogenic emissions. Avoid cartoon Earth and promotional poster styles.
Create a publication-ready scientific figure about the global carbon cycle with atmospheric, oceanic, and terrestrial carbon fluxes. Show carbon storage and exchange among the atmosphere, vegetation, soil, ocean, and human activities, including photosynthesis, respiration, air-sea exchange, fossil fuel emissions, land-use change, and carbon sinks.Use a system cycle or flux-map layout with directional arrows between reservoirs. Use arrow thickness or color to distinguish major and minor fluxes. Use a clean scientific atlas style suitable for environmental science and Earth system research.
The keywords for a system cycle diagram are reservoirs + fluxes + feedback. That is: which reservoirs there are, how the fluxes move, and whether there are feedback loops.
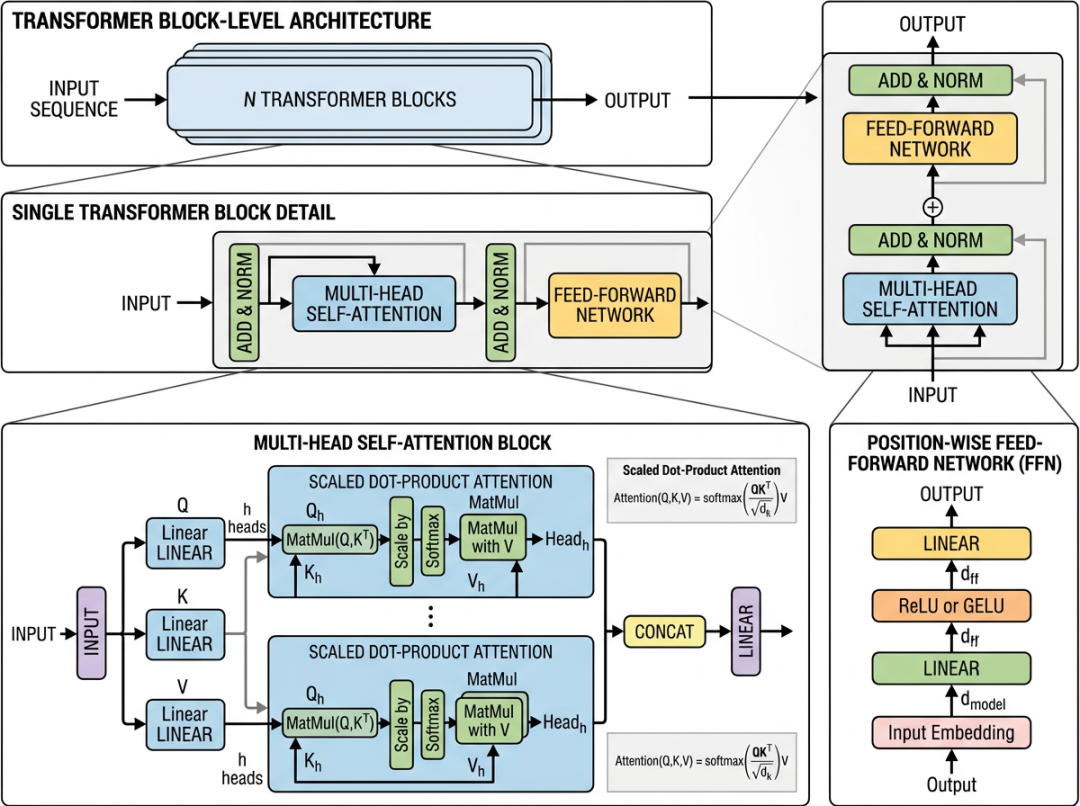
05 | AI architecture diagram: Transformer model structure
Computer science, AI, and information science fields can also use GPT Image 2 to make scientific figures.
But this type of figure is most afraid of turning into a "techy background image." If what you want is a model structure figure in a paper, you must write architecture, blocks, and data flow, rather than only writing artificial intelligence.
Draw an AI model structure figure. Make it feel high-tech.
This sentence easily generates glowing circuit boards and abstract data streams, but not a usable paper figure.
Please generate a scientific schematic of Transformer model architecture. The figure should show input token embedding, positional encoding, multi-head self-attention module, residual connection, layer normalization, feed-forward neural network, stacked encoder modules, and final output representation. Please use a modular system architecture layout, showing the data flow from left to right or from bottom to top. Each module should be represented by a clean rectangle or functional block, and arrows should connect input, attention calculation, feed-forward transformation, and output result. The overall style should be concise and clear, suitable for a machine-learning paper or academic presentation. Please use a white background, a blue-gray main color, and a small amount of orange to highlight the attention module. Avoid cyberpunk style, glowing backgrounds, and meaningless data-flow decoration.
Create a publication-ready scientific figure about Transformer model architecture with attention and feed-forward blocks. Show input token embeddings, positional encoding, multi-head self-attention, residual connections, layer normalization, feed-forward neural networks, stacked encoder blocks, and final output representation.Use a modular system architecture layout with clear data flow arrows. Represent each component as a clean block. Use a minimal schematic style with a white background, blue-gray palette, and orange accents for the attention module. Avoid cyberpunk style, glowing background, and decorative data streams.
For AI architecture diagrams, do not write "techy feel." Write clearly: what the input is, which modules there are, how the data flow moves, and what the output is.
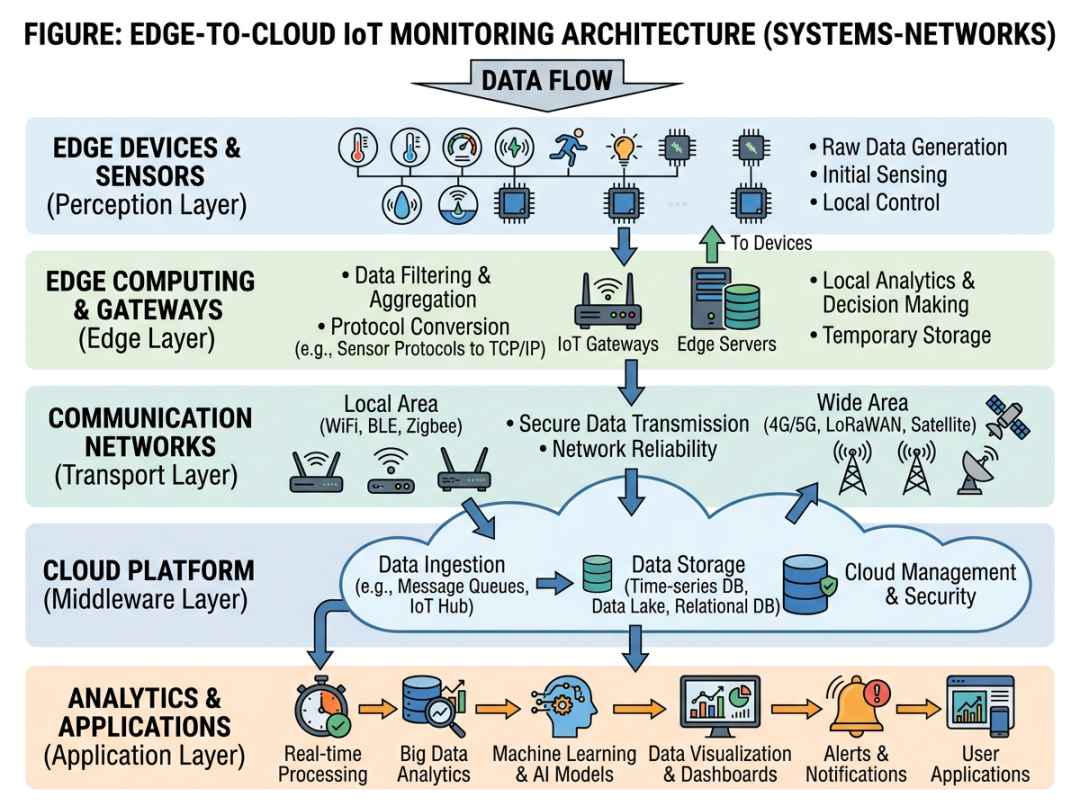
06 | Engineering system diagram: IoT monitoring architecture
Engineering, sensors, smart agriculture, industrial internet, and environmental monitoring fields often need to draw a system architecture "from acquisition to analysis."
The key to this type of figure is to layer the system, rather than piling all devices together.
Draw an IoT monitoring system.
This sentence does not explain where the data comes from, which layers it passes through, or where it finally goes.
Please generate a scientific schematic of an IoT monitoring system architecture. The figure should show a complete data chain from edge sensors to cloud analytics, including field sensor nodes, edge gateway, wireless communication network, cloud database, data analysis model, visualization dashboard, and warning feedback. Please use a layered system architecture layout, showing data collection, transmission, storage, analysis, and decision output from left to right. Please use arrows to indicate data flow, and loop arrows to indicate feedback control. The overall style should be clean and professional, suitable for engineering papers and project presentations. Please use a white background, flat vector style, unified line width, and concise labels. Avoid complex 3D scenes and commercial promotional image styles.
Create a publication-ready scientific figure about an IoT monitoring architecture from edge sensors to cloud analytics. Show field sensor nodes, edge gateway, wireless communication network, cloud database, analytics model, visualization dashboard, and alert feedback.Use a layered system architecture layout from left to right: data acquisition, transmission, storage, analysis, and decision output. Use arrows to show data flow and feedback control loops. Use a clean vector style with a white background and concise labels.
System architecture diagrams need to state hierarchy and data flow clearly. For example: perception layer, transmission layer, storage layer, analysis layer, and application layer.
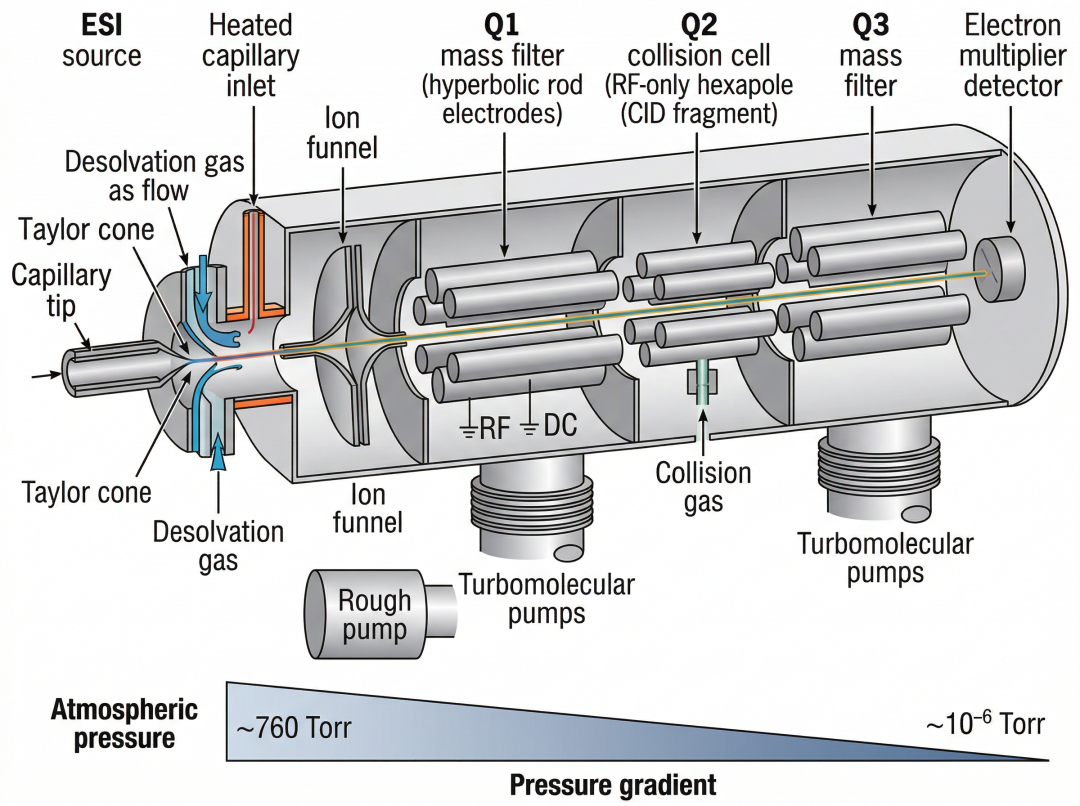
07 | Instrument structure diagram: triple quadrupole mass spectrometer
If you want to introduce an experimental platform, instrument principle, or detection system, the prompt must be as specific as possible.
An instrument figure cannot only write the instrument name. You need to tell the model which modules are inside, how the sample enters, how the signal is transmitted, and how it is finally detected.
Draw a mass spectrometer structure diagram.
This sentence easily generates only an instrument shell, lacking the internal working principle.
Please generate a technical cutaway schematic of a triple quadrupole mass spectrometer. The figure should show the electrospray ionization source, heated capillary inlet, ion funnel, Q1 mass filter, Q2 collision cell, Q3 mass filter, electron multiplier detector, and vacuum pump system. Please use arrows to show the movement trajectory of ions from the sample inlet to the detector, and label different vacuum regions and pressure gradients. Please use a technical cutaway layout so that the internal structure of the instrument and the signal transmission pathway are clearly visible. The overall style should be professional and precise, suitable for an analytical chemistry paper or an introduction to instrument principles. Please use a blue-gray technical diagram style, with clear labels, and avoid exaggerated perspective and complex backgrounds.
Create a technical cutaway diagram of a triple quadrupole mass spectrometer. Show the electrospray ionization source, heated capillary inlet, ion funnel, Q1 mass filter, Q2 collision cell, Q3 mass filter, electron multiplier detector, and vacuum pump stages.Show the ion trajectory path from the sample inlet to the detector, and label the pressure gradient across vacuum regions. Use a precise technical cutaway layout with clear labels and arrows. Use a blue-gray scientific engineering style and avoid decorative background.
The key to an instrument structure diagram is: module names + sample path + signal path + detection output. If you only write the instrument name, it is hard for the model to know whether you want to draw the appearance or the principle.
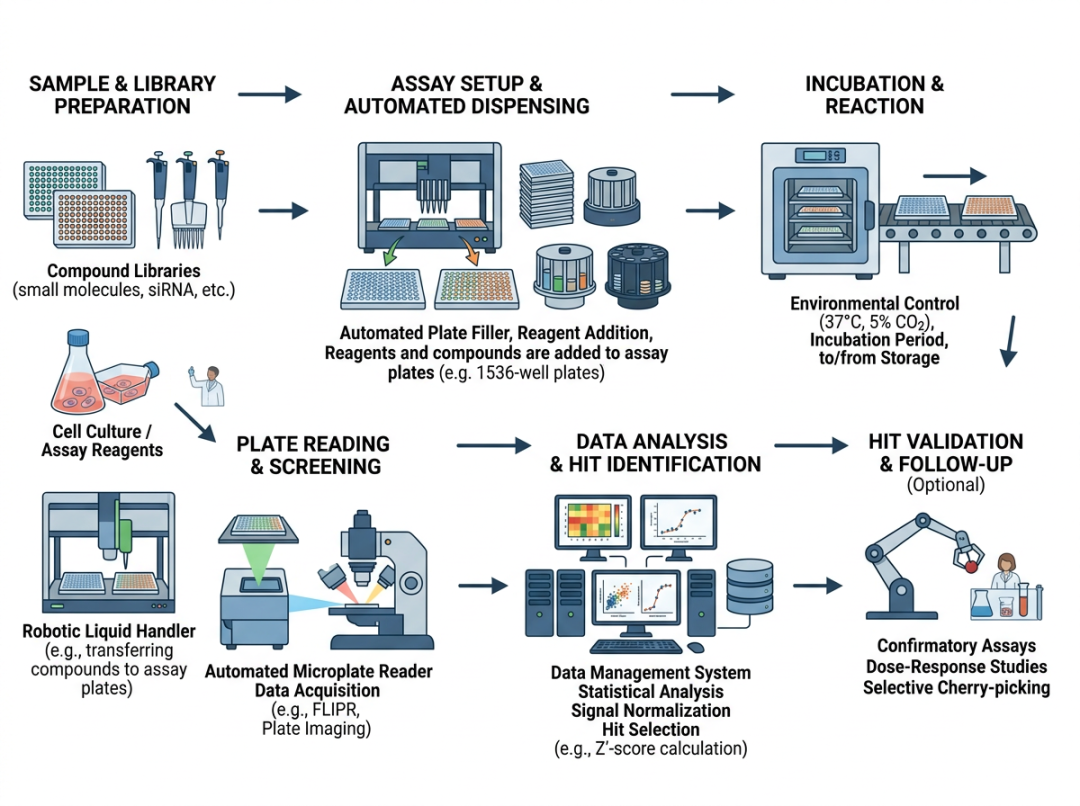
08 | Experimental workflow diagram: high-throughput screening workflow
Paper methods overviews, grant technical routes, and group-meeting presentations often need experimental workflow diagrams.
What matters most for this type of figure is: clear steps, clear sequence, and understandable at a glance.
Draw a high-throughput screening workflow diagram.
This sentence is too rough. The model does not know which steps you want to show.
Please generate a high-throughput screening experimental workflow diagram. The figure should sequentially show sample preparation, automated liquid addition, reaction incubation, plate reading, data normalization, candidate hit screening, and secondary validation. Please use a left-to-right flowchart layout, and represent each step with an independent small scene or icon-like scientific element, such as sample tubes, pipetting robot, multiwell plate, plate reader, data charts, and validation experiment. Please connect all steps with arrows and keep the workflow clear at a glance. The overall style should be modern, concise, and professional, suitable for a methodology paper or project report. Please use a white background, blue-gray as the main color, and orange to highlight candidate results. Avoid complex backgrounds and do not add too many text labels.
Create a publication-ready scientific workflow diagram for laboratory automation in high-throughput screening. Show sample preparation, automated liquid handling, incubation, plate reading, data normalization, hit selection, and secondary validation.Use a left-to-right workflow layout. Represent each step with a clean icon or mini-scene, such as sample tubes, liquid-handling robot, multiwell plate, plate reader, data charts, and validation assay. Connect all steps with arrows and keep the workflow easy to understand.
A workflow diagram must write out each step. Otherwise, the model may only draw one instrument or one lab bench, rather than a complete workflow.
A general scientific figure prompt template that can be directly applied
If you do not want to write from scratch each time, you can directly use the master template below.
Chinese master template
Please generate a [type of figure] for paper publication. The topic is [research topic]. The figure should show [main object], [key structure/process 1], [key structure/process 2], and [final result]. Please use a [composition method] layout, such as a left-to-right workflow diagram, top-to-bottom layered mechanism figure, central scene plus local zoom-in view, system architecture diagram, cyclic flux diagram, or technical cutaway diagram. Please use arrows, local zoom-in views, layered structures, or module connections to strengthen the scientific logic. The overall style should be clean, professional, suitable for paper publication or academic presentation, and have clear structural hierarchy and good readability. Please use [background requirement], use [main color] as the main color, and use [accent color] to highlight key events. Avoid excessive text, complex backgrounds, exaggerated 3D rendering, cartoon style, and promotional-poster feel.
English Master Prompt
Create a publication-ready 【type of figure】 about 【research topic】.Show 【main object】, 【key structure/process 1】, 【key structure/process 2】, and 【final outcome】.Use a 【layout type】 composition, such as a left-to-right workflow, layered cross-section, central mechanism with zoom-in panels, system architecture, cycle/flux map, or technical cutaway.Use arrows, zoom-in views, layered structures, or modular connections to clarify the scientific logic.Use a clean, professional scientific illustration style suitable for research papers and academic slides. Keep the background simple, labels readable, and visual hierarchy clear. Avoid excessive text, decorative background, cartoon style, stock-photo look, and overly glossy CGI rendering.
The core structure of a truly universal scientific figure prompt is actually very stable:
Figure type + main object + structure/mechanism chain + composition method + style constraints + negative restrictions.
As long as you write in this order, the stability of the prompt will be significantly higher than "writing whatever comes to mind."
Another easily overlooked problem: how do you edit after generation?
Writing prompts well can indeed make the first draft of the figure more stable.
But the most troublesome part of scientific figure drawing is often not generation, but later revision.
When your supervisor asks you to change an arrow, replace a label, adjust the color scheme, change Chinese into English, or split an entire complex mechanism figure into PPT animations, it will be very painful if all you have is a PNG.
So the workflow I now recommend more is:
First use AI to generate a scientific figure draft, then turn it into editable material.
The cases I used above this time mainly come from FigPad Gallery. It contains many ready-made scientific figures and prompts, so you can directly refer to the structure and adapt it to your own topic.
More importantly, FigPad does not only generate one image. It also supports exporting PPTX / SVG / PNG.
In other words, later you can continue editing text, changing colors, moving arrows, and splitting animations in PPT or vector software.
If you only want to quickly get the first version of a scientific figure, GPT Image 2 is already very useful. But if you want the figure to later be used in papers, group meetings, grants, and defenses, I suggest treating it as "editable scientific material" from the beginning.
FigPad Gallery: https://figpad.ai/gallery
FigPad: https://figpad.ai/
Use Citely to check draft references and automatically recommend references
Scientific Figure Drawing: How to Directly Generate Editable PPT
How to efficiently look up papers in reverse? Get authoritative Chinese and English paper citations with one click
Scientific Figure Drawing: Generate Editable Vector Graphics with AI in One Click
